
2
Follow
478
Followers
개요
이 전략은 가격 돌파구와 동적으로 트래킹된 스톱로스를 기반으로 한 거래 시스템이다. 이 전략은 지능적인 스톱로스 메커니즘을 채택하고 있으며, 1%의 수익을 달성한 후에만 트래킹 스톱로스를 활성화하여 수익을 충분히 발전시킬 수 있다. 동시에 1시간의 냉각 시간을 설정하여 과도한 거래를 피하고, 각 거래의 품질을 향상시킨다.
전략 원칙
전략의 핵심 논리는 다음과 같은 핵심 부분으로 구성됩니다.
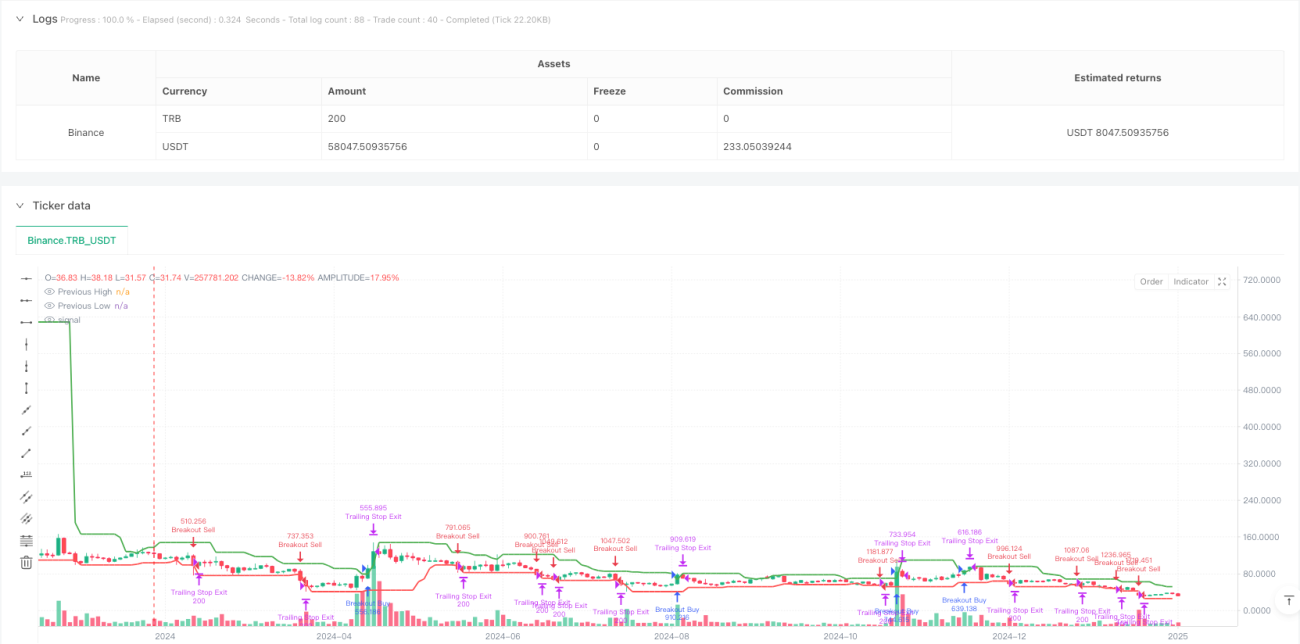
- 입구 신호: 지난 N주기의 최고 가격과 최저 가격을 계산하여 현재 가격이 이러한 수준을 돌파할 때 거래 신호를 유발합니다. 다중 입구는 가격이 이전 고점을 돌파하는 특정 비율을 요구하며, 공백은 이전 저점을 돌파해야합니다.
- 거래 관리: 1시간의 거래 냉각 기간을 시행하여, 급격한 변동이 있을 때 자주 거래하는 것을 피한다.
- 위험 제어: 동적 추적 스톱을 사용하여 1%의 수익을 얻은 후에만 활성화하여 수익을 더 잘 보호 할 수 있습니다.
- 매개 변수 최적화: 회전 주기, 돌파 한계, 스톱 손실 비율과 같은 핵심 매개 변수는 다른 시장 상황에 따라 조정할 수 있다.
전략적 이점
- 동적 위험 관리: 스톱 로즈 메커니즘을 추적함으로써, 전략은 수익을 보호하면서 수익을 지속적으로 증가시킬 수 있습니다.
- 유연한 적응력: 전략은 다양한 시장 조건에 적응할 수 있으며, 매개 변수를 조정하여 성능을 최적화한다.
- 필터링 메커니즘: 거래 냉각 기간을 사용하여 과도한 거래를 방지하고 거래 품질을 향상시킵니다.
- 간단하고 효과적입니다. 전략 논리는 명확하고, 이해하기 쉽고, 실행이 쉬우면서도 확장성이 좋습니다.
전략적 위험
- 가짜 돌파 위험: 시장에서 가짜 돌파가 발생할 수 있으며, 이는 잘못된 신호로 이어질 수 있다.
- 슬라이드 포인트 영향: 높은 변동 기간 동안, 전략의 성과에 영향을 미치는 큰 슬라이드 포인트에 직면 할 수 있습니다.
- 매개 변수 민감성: 정책의 성능은 매개 변수 설정에 민감하며, 신중한 최적화가 필요합니다.
- 시장 환경 의존성: 낮은 변동률 환경에서는 좋지 않은 성과를 낼 수 있다.
전략 최적화 방향
- 거래량 지표 도입: 거래량 확인을 통해 돌파 신호의 신뢰성을 높인다.
- 트렌드 필터링을 추가합니다: 장기적인 트렌드 지표와 결합하여 트렌드 방향으로만 거래합니다.
- 동적 변수 조정: 시장의 변동에 따라 돌파한한치와 중지 손실 변수를 자동으로 조정한다.
- 다중 시간 주기: 정확도를 높이기 위해 여러 시간 주기의 신호를 통합한다.
요약하다
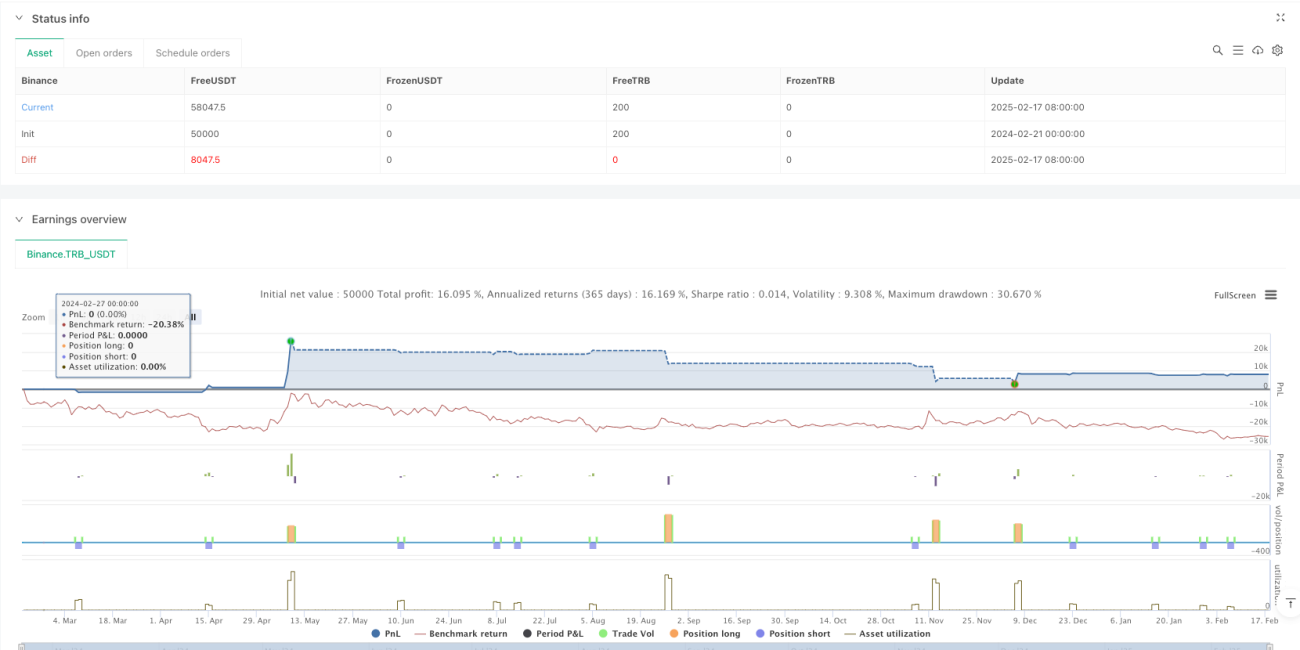
이는 합리적으로 설계된 트렌드 추적 전략으로, 가격 돌파구와 동적 스톱로스를 결합하여 큰 트렌드를 포착하고 위험을 효과적으로 제어 할 수 있습니다. 전략은 커스터마이징이 강하며, 매개 변수를 최적화하여 다른 시장 환경에 적응 할 수 있습니다. 실물에서 작은 포지션에서 시작하여 다양한 시장 조건에서 전략을 점진적으로 검증하는 것이 좋습니다.
Source
Pine
Strategy parameters
Related strategies
Comment
All comments (0)
No data
- 1