ATR 동적 손절매 및 손절매 수익과 결합된 다중 지표 추세 추적 전략

EMA RSI ATR SMA
생성 날짜: 2025-02-20 17:04:19 마지막으로 수정됨: 2025-02-27 17:27:13
복사: 1 클릭수: 368
avatar of ianzeng123 ianzeng123
2
집중하다
319
수행원

ATR 동적 손절매 및 손절매 수익과 결합된 다중 지표 추세 추적 전략 ATR 동적 손절매 및 손절매 수익과 결합된 다중 지표 추세 추적 전략

개요

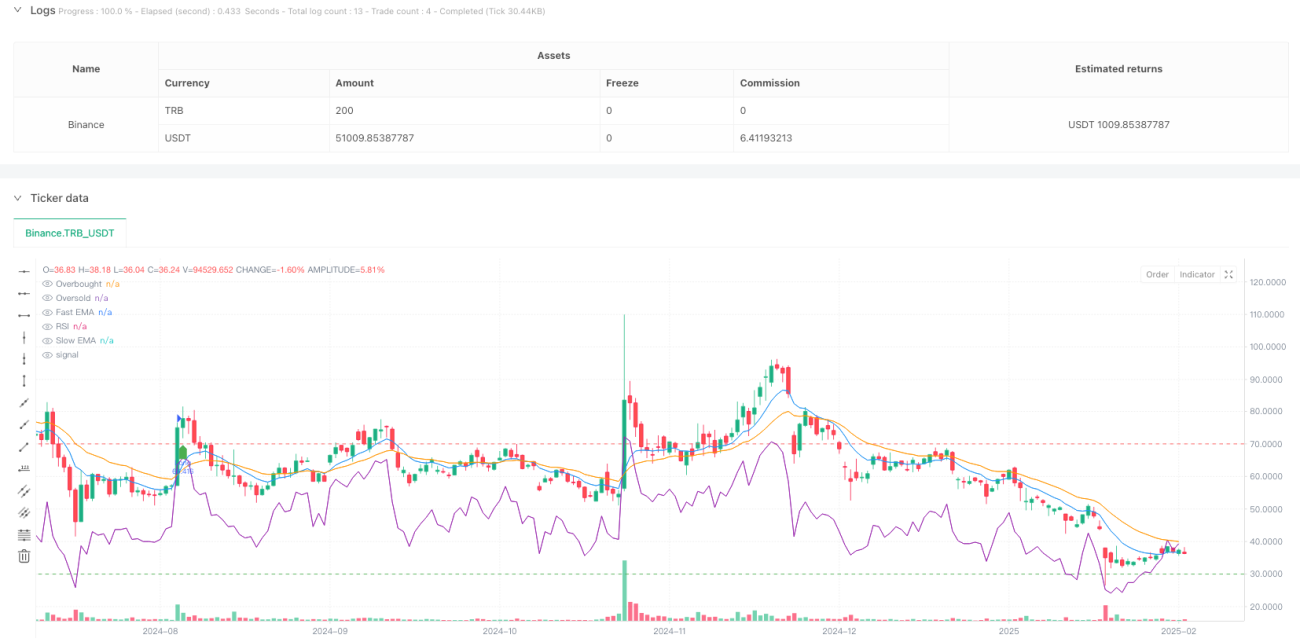
이 전략은 다중 기술 지표에 기반한 트렌드 추적 거래 시스템이다. 그것은 평균선 (EMA), 상대적으로 강한 지표 (RSI), 거래량 (Volume) 및 실제 파도 지표 (ATR) 을 결합하여 진입 시기를 결정하고 ATR을 사용하여 역동적으로 스톱 및 스톱 위치를 설정한다. 전략은 또한 거래 신호의 신뢰성을 높이기 위해 K선 돌파 확인 메커니즘을 추가한다.

전략 원칙

전략은 빠른 EMA ((9주기) 와 느린 EMA ((21주기) 의 교차를 사용하여 트렌드 변화를 포착한다. 이 기초에, RSI 지표 ((14주기) 와 결합하여 과도한 매매 지역을 필터링하고, RSI 수치를 초매 ((70) 와 초매 ((30) 지역 밖에서 요구한다. 동시에, 전략은 20주기 매매 평균보다 큰 거래량을 요구하며, 매각 가격이 추가적인 입력을 확인하기 위해 이전 K 라인의 높은 낮은 지점을 돌파해야 한다.

전략적 이점

  1. 다중 기술 지표의 통합 적용은 거래 신호의 신뢰성을 향상시킵니다.
  2. 동적 스톱 스 설정은 시장의 변동성에 적응합니다.
  3. 추적 중지 메커니즘이 수익을 효과적으로 보호합니다.
  4. 거래량 확인 메커니즘은 가짜 돌파구를 줄여줍니다.
  5. K선 돌파 확인은 거래의 정확도를 높였습니다.
  6. 전략 매개 변수는 시장 특성에 따라 유연하게 조정됩니다.

전략적 위험

  1. 다중 지표로 인해 일부 거래 기회를 놓칠 수 있습니다.
  2. 수평 시장에서 빈번하게 잘못된 신호가 발생할 수 있습니다.
  3. 빠른 급격한 변동으로 인해 막상 위치가 이상적이지 않을 수 있습니다.
  4. 대폭 폭파로 인해 예상 이상의 손실이 발생할 수 있습니다. 위험 관리에는 다음과 같은 것이 필요합니다.
  • 시장 변화에 맞춰 주기적으로 최적화
  • 더 큰 시간 주기의 움직임과 결합하여 거래 필터링
  • 하루 최대 거래 수 제한을 설정합니다.
  • 합리적인 재무 관리 계획을 실행하세요.

전략 최적화 방향

  1. 자율적 지표 변수를 입력합니다: 시장의 변동에 따라 EMA와 RSI의 주기적 설정을 자동으로 조정하여 전략이 다른 시장 환경에 더 잘 적응 할 수 있습니다.

  2. 시장 환경 필터 추가: ADX와 같은 트렌드 강도 지표를 추가하여 수평 시장에서 자동으로 포지션을 줄이거나 거래를 중지하십시오.

  3. 손해배상 방안을 최적화합니다. 지원 저항 위치 설정과 결합하여 손실을 막는 효과를 높이는 것을 고려할 수 있다.

  4. 거래량 관리를 개선합니다. 시장의 변동성과 유동성 동력에 따라 지분 규모를 조정한다.

요약하다

이것은 구조적으로 완전하고 논리적으로 엄격한 트렌드 추적 전략이다. 다중 기술 지표의 조합 사용으로 거래 신호의 신뢰성을 보장하고 위험을 효과적으로 제어 할 수 있습니다. 동적 인 스톱 스탠드 설정은 위험과 수익에 비해 좋은 위험을 제공합니다. 전략의 최적화 공간은 넓고, 지속적인 개선으로 더 많은 시장 환경에 적응 할 수 있습니다.
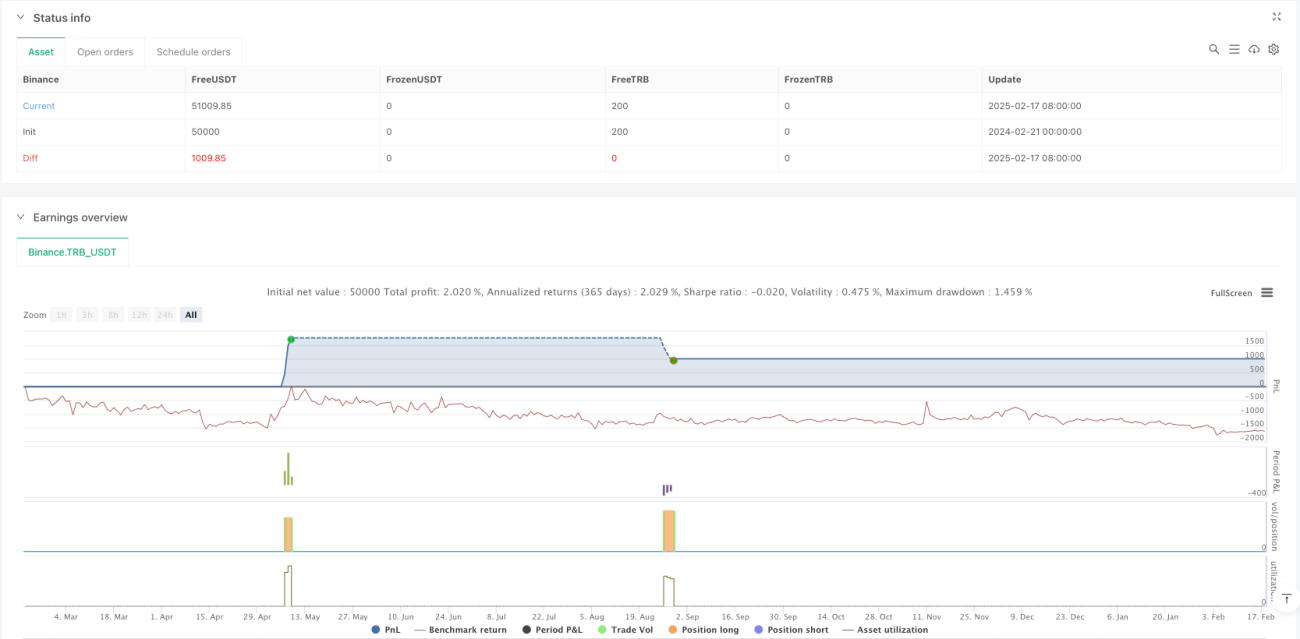
전략 소스 코드
/*backtest
start: 2024-02-21 00:00:00
end: 2025-02-18 08:00:00
period: 1d
basePeriod: 1d
exchanges: [{"eid":"Binance","currency":"TRB_USDT"}]
*/

//@version=6
strategy("15m EMA RSI Strategy with ATR SL/TP and Candle Break Confirmation", overlay=true, initial_capital=100000, default_qty_type=strategy.percent_of_equity, default_qty_value=10)

// INPUTS
fastLength         = input.int(9, title="Fast EMA Length")
slowLength         = input.int(21, title="Slow EMA Length")
rsiLength          = input.int(14, title="RSI Length")
rsiOverbought      = input.int(70, title="RSI Overbought Level")
rsiOversold        = input.int(30, title="RSI Oversold Level")
volLength          = input.int(20, title="Volume MA Length")
atrLength          = input.int(14, title="ATR Length")
atrMultiplierSL    = input.float(1.5, title="ATR Multiplier for Stop Loss")
atrMultiplierTP    = input.float(3.0, title="ATR Multiplier for Take Profit")
trailingStopMultiplier = input.float(1.0, title="ATR Multiplier for Trailing Stop")

// INDICATOR CALCULATIONS
fastEMA  = ta.ema(close, fastLength)
slowEMA  = ta.ema(close, slowLength)
rsiValue = ta.rsi(close, rsiLength)
volMA    = ta.sma(volume, volLength)
atr      = ta.atr(atrLength)

// Candle Breakout Conditions for Confirmation
longCandleBreak  = close > high[1]
shortCandleBreak = close < low[1]

// Plot EMAs for visual reference
plot(fastEMA, color=color.blue, title="Fast EMA")
plot(slowEMA, color=color.orange, title="Slow EMA")

// ENTRY CONDITIONS
longCondition = ta.crossover(fastEMA, slowEMA) and (rsiValue < rsiOverbought) and (volume > volMA) and longCandleBreak
shortCondition = ta.crossunder(fastEMA, slowEMA) and (rsiValue > rsiOversold) and (volume > volMA) and shortCandleBreak

// Plot Buy/Sell Signals on the Chart
plotshape(longCondition, title="Buy Signal", location=location.belowbar, color=color.green, style=shape.labelup, size=size.normal)
plotshape(shortCondition, title="Sell Signal", location=location.abovebar, color=color.red, style=shape.labeldown, size=size.normal)

// TRADE EXECUTION WITH ATR-BASED STOP LOSS, TAKE PROFIT, AND TRAILING STOP
if longCondition
    longStop = close - atrMultiplierSL * atr
    longTP   = close + atrMultiplierTP * atr
    strategy.entry("Long", strategy.long)
    strategy.exit("Exit Long", from_entry="Long", stop=longStop, limit=longTP, trail_points=atr * trailingStopMultiplier)

if shortCondition
    shortStop = close + atrMultiplierSL * atr
    shortTP   = close - atrMultiplierTP * atr
    strategy.entry("Short", strategy.short)
    strategy.exit("Exit Short", from_entry="Short", stop=shortStop, limit=shortTP, trail_points=atr * trailingStopMultiplier)

// OPTIONAL: Plot RSI for reference
hline(rsiOverbought, "Overbought", color=color.red)
hline(rsiOversold, "Oversold", color=color.green)
plot(rsiValue, color=color.purple, title="RSI")