개요
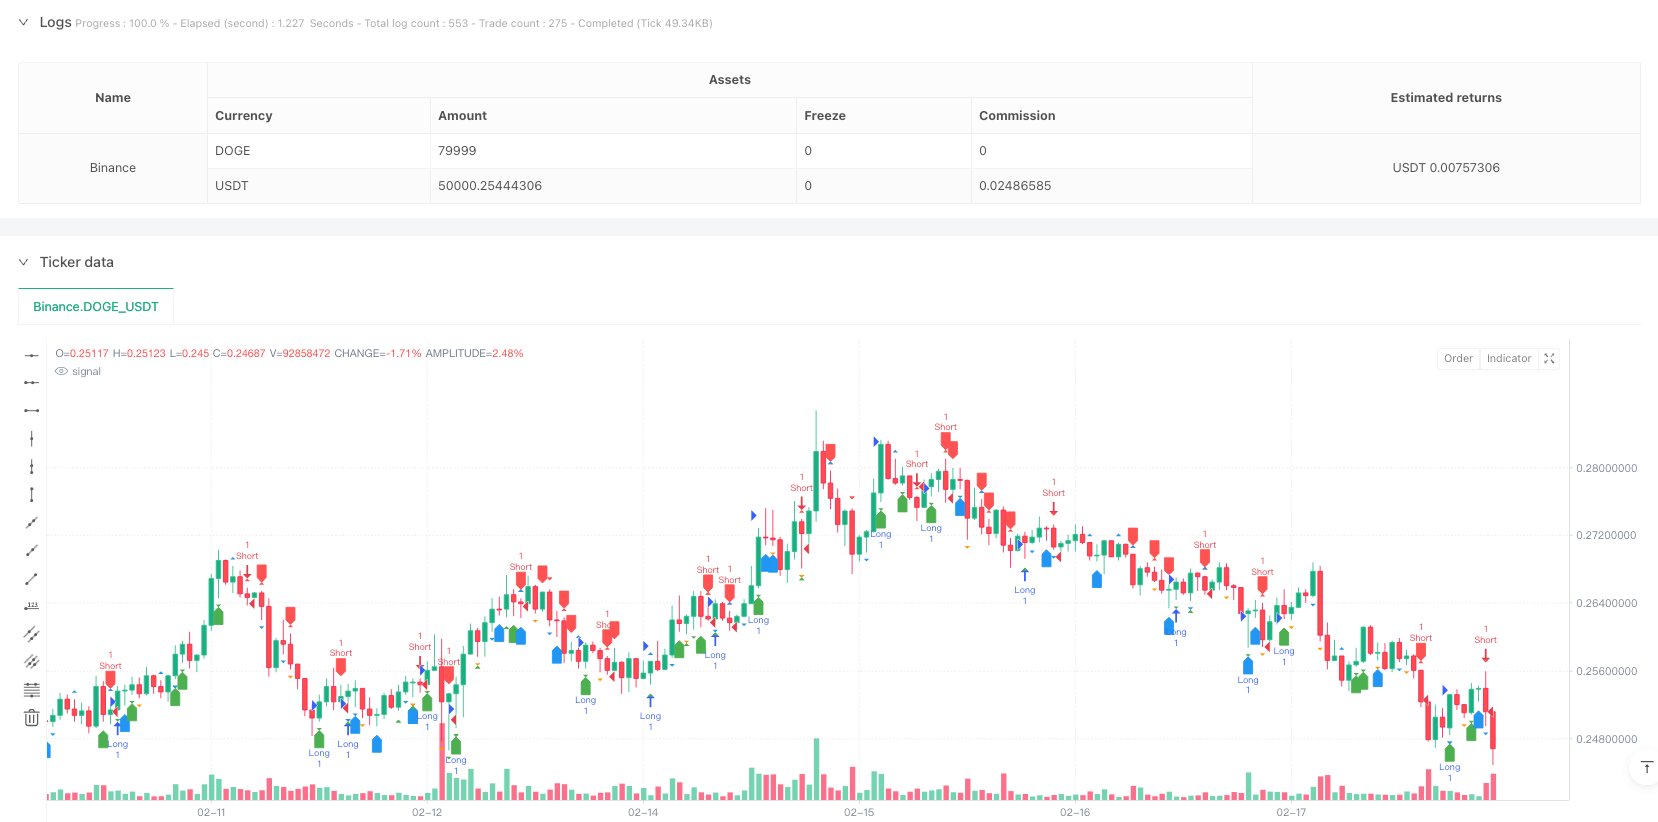
이 전략은 포괄적 인 기술 분석 시스템으로, 여러 가지 K선 형태와 트렌드 라인 형태를 결합하여 거래 신호를 생성한다. 전략은 여러 가지 고전적인 K선 형태를 식별하여 (예: 삼락 형태, 오리 선, 스타 등) 및 차트 형태 (예: 쌍탑, 쌍본, 삼각형, 깃발 등) 시장 추세의 전환점을 판단하고 적절한 시기에 거래 신호를 발송한다. 동시에, 전략은 어깨 어깨 형태를 인식하는 것을 통합하여 거래 의사 결정에 더 포괄적인 기술 분석 지원을 제공합니다.
전략 원칙
이 전략은 다음과 같은 핵심 구성 요소를 기반으로 합니다.
- K선 형태 인식 시스템, 여러 고전적인 시상 및 시상 형태를 포함, 흡수 형태, 子線, 上吊線, 啟星, 夕星, 穿透線, 乌雲蓋和孕線等.
- 트렌드 라인 형태 분석 시스템, 쌍탑 쌍본, 대칭 삼각형, 상승 삼각형, 하강 삼각형, 깃발 모양, 삼각형 깃발 및 통로 등의 형태를 식별하기 위해 사용됩니다.
- 특수 형태 인식 시스템, 특히 머리 어깨 꼭대기 및 머리 어깨 밑과 같은 복잡한 형태를 식별하기 위해.
- 리스크 관리 시스템, 중지 손실 및 중지 설정으로 거래 위험을 제어한다.
전략적 이점
- 다차원 분석: 다양한 기술 지표와 그래픽 형태를 결합하여 더 포괄적인 시장 분석 관점을 제공합니다.
- 위험 통제: 전략은 각 거래의 위험을 효과적으로 통제할 수 있는 중지 및 중지 메커니즘을 내장하고 있다.
- 형태 인식 정확성: 엄격한 수학적 계산과 조건 판단을 통해 형태 인식의 정확성을 보장한다.
- 적응력: 전략은 다른 시장 환경과 시간 주기에서 작동할 수 있다.
- 시각적 지원: 명확한 그래픽 표시를 제공하여 거래자가 시장 상황을 직관적으로 이해할 수 있도록 도와줍니다.
전략적 위험
- 가짜 브레이크 위험: 가로 디스크 영역에서 가짜 브레이크 신호가 발생할 수 있으며, 이는 잘못된 거래로 이어질 수 있다.
- 지연 위험: 형상 인식에는 지연성이 있어 입학 시점에 영향을 미칠 수 있다.
- 시장 환경 의존: 급격한 변동이나 추세가 보이지 않는 시장 환경에서는 전략의 효과가 약해질 수 있다.
- 매개 변수 민감성: 전략의 여러 판단 조건은 매개 변수 설정에 의존하며, 매개 변수 선택이 적절하지 않으면 정책의 성능에 영향을 줄 수 있다.
전략 최적화 방향
- 양과 가격 관계 분석을 도입: 교류량 지표를 결합하여 형태 인식의 신뢰성을 향상시킨다.
- 최적화 스톱 손실 설정: 스톱 손실 거리를 변동률에 따라 동적으로 조정할 수 있습니다.
- 트렌드 필터를 추가: 트렌드 판단 지표를 도입하여横盘 시장에서 과도한 거래를 피하십시오.
- 리스크 관리를 개선: 보유 기간 제한 및 최대 손실 제한과 같은 리스크 제어 수단을 늘립니다.
- 시장 환경 인식 추가: 시장 환경 판단 모듈을 개발하여 다른 시장 조건에 따라 전략 매개 변수를 조정하십시오.
요약하다
이 전략은 여러 가지 기술적 분석 방법을 통합하여 완전한 거래 시스템을 구축합니다. 전략의 장점은 다차원 분석과 완벽한 위험 제어이지만 동시에 가짜 돌파구 및 후기성 등의 위험에 직면합니다. 지속적인 최적화 및 개선으로 전략은 실제 거래에서 더 나은 성능을 얻을 수 있습니다.
전략 소스 코드
/*backtest
start: 2025-01-20 00:00:00
end: 2025-02-19 00:00:00
period: 1h
basePeriod: 1h
exchanges: [{"eid":"Binance","currency":"DOGE_USDT"}]
*/

//@version=6
strategy("Advanced Candlestick and Line Chart Patterns with Head and Shoulders", overlay=true)

// --- Candlestick Patterns ---
isBullishEngulfing = close > open[1] and open < close[1]
isBearishEngulfing = close < open[1] and open > close[1]

isHammer = (high - low) > 2 * (open - close) and (close - low) / (0.001 + high - low) > 0.6 and (open - low) / (0.001 + high - low) > 0.6
isHangingMan = isHammer and close < open
isDoji = math.abs(close - open) <= 0.1 * (high - low)
isMorningStar = close[2] < open[2] and close[1] > open[1] and close > open and close > close[2] and open[1] > close[2]
isEveningStar = close[2] > open[2] and close[1] < open[1] and close < open and close < close[2] and open[1] < close[2]
isPiercingLine = close > open and close[1] < open[1] and close > open[1] and open < close[1]
isDarkCloudCover = close < open and close[1] > open[1] and close < open[1] and open > close[1]
isBullishHarami = close > open[1] and open < close[1] and close > open and close[1] > open
isBearishHarami = close < open[1] and open > close[1] and close < open and close[1] < open

// --- Line Chart Patterns ---

// Double Top and Double Bottom
doubleTop = (high[2] > high[1] and high[1] < high and close < open[1])
doubleBottom = (low[2] < low[1] and low[1] > low and close > open[1])

// Symmetrical Triangles
symmetricalTriangle = (high[2] > high[1] and low[2] < low[1] and high > high[1] and low > low[1])

// Ascending Triangle
ascendingTriangle = (high[2] < high[1] and low[2] > low[1] and high > high[1] and low > low[1])

// Descending Triangle
descendingTriangle = (high[2] > high[1] and low[2] < low[1] and high < high[1] and low < low[1])

// Flags and Pennants
isFlag = (high[1] > high[2] and low[1] > low[2] and high < high[1] and low < low[1])
isPennant = (high[2] < high[1] and low[2] > low[1] and high > high[1] and low < low[1])

// Channel Formation
isChannel = (high[2] > high[1] and low[2] < low[1] and high > high[1] and low < low[1])

// Diamond Pattern
isDiamond = (high[2] < high[1] and low[2] > low[1] and high > high[1] and low < low[1] and high[1] < high and low[1] > low)

// --- Head and Shoulders Patterns ---
// Head and Shoulders
isHeadAndShoulders = high[2] > high[1] and high[1] < high and close < open[1]

// Inverse Head and Shoulders
isInverseHeadAndShoulders = low[2] < low[1] and low[1] > low and close > open[1]

// --- Visual Representation ---
plotshape(series=isBullishEngulfing, location=location.belowbar, color=color.green, style=shape.labelup, title="Bullish Engulfing")
plotshape(series=isBearishEngulfing, location=location.abovebar, color=color.red, style=shape.labeldown, title="Bearish Engulfing")

plotshape(series=isHammer, location=location.belowbar, color=color.green, style=shape.triangledown, title="Hammer")
plotshape(series=isHangingMan, location=location.abovebar, color=color.red, style=shape.triangleup, title="Hanging Man")

plotshape(series=isDoji, location=location.belowbar, color=color.blue, style=shape.labelup, title="Doji")
plotshape(series=isMorningStar, location=location.belowbar, color=color.green, style=shape.triangledown, title="Morning Star")
plotshape(series=isEveningStar, location=location.abovebar, color=color.red, style=shape.triangleup, title="Evening Star")

plotshape(series=isPiercingLine, location=location.belowbar, color=color.green, style=shape.triangleup, title="Piercing Line")
plotshape(series=isDarkCloudCover, location=location.abovebar, color=color.red, style=shape.triangledown, title="Dark Cloud Cover")

plotshape(series=isBullishHarami, location=location.belowbar, color=color.green, style=shape.triangledown, title="Bullish Harami")
plotshape(series=isBearishHarami, location=location.abovebar, color=color.red, style=shape.triangleup, title="Bearish Harami")

// Line Chart Pattern Visualization
plotshape(series=doubleTop, location=location.abovebar, color=color.red, style=shape.triangledown, title="Double Top")
plotshape(series=doubleBottom, location=location.belowbar, color=color.green, style=shape.triangleup, title="Double Bottom")

plotshape(series=symmetricalTriangle, location=location.belowbar, color=color.blue, style=shape.triangledown, title="Symmetrical Triangle")
plotshape(series=ascendingTriangle, location=location.belowbar, color=color.blue, style=shape.triangledown, title="Ascending Triangle")
plotshape(series=descendingTriangle, location=location.abovebar, color=color.blue, style=shape.triangleup, title="Descending Triangle")

plotshape(series=isFlag, location=location.belowbar, color=color.orange, style=shape.triangledown, title="Flag")
plotshape(series=isPennant, location=location.belowbar, color=color.purple, style=shape.triangledown, title="Pennant")

plotshape(series=isChannel, location=location.belowbar, color=color.blue, style=shape.triangledown, title="Channel")
plotshape(series=isDiamond, location=location.abovebar, color=color.blue, style=shape.triangledown, title="Diamond")

// Head and Shoulders Pattern Visualization
plotshape(series=isHeadAndShoulders, location=location.abovebar, color=color.red, style=shape.triangledown, title="Head and Shoulders")
plotshape(series=isInverseHeadAndShoulders, location=location.belowbar, color=color.green, style=shape.triangleup, title="Inverse Head and Shoulders")

// --- Strategy Logic ---
longCondition = isBullishEngulfing or isHammer or isMorningStar or isPiercingLine or isBullishHarami or doubleBottom or isInverseHeadAndShoulders
shortCondition = isBearishEngulfing or isHangingMan or isEveningStar or isDarkCloudCover or isBearishHarami or doubleTop or isHeadAndShoulders

if (longCondition)
    strategy.entry("Long", strategy.long)
if (shortCondition)
    strategy.entry("Short", strategy.short)

// Stop-Loss and Take-Profit
strategy.exit("Take Profit/Stop Loss", "Long", stop=low - 10, limit=high + 10)
strategy.exit("Take Profit/Stop Loss", "Short", stop=high + 10, limit=low - 10)