다중 레벨 EMA 및 RSI 동적 잠재 강도를 기반으로 한 비트코인 ​​크로스 사이클 트렌드 거래 전략

EMA RSI ATR
생성 날짜: 2025-02-20 17:14:37 마지막으로 수정됨: 2025-02-27 17:24:26
복사: 0 클릭수: 422
avatar of ianzeng123 ianzeng123
2
집중하다
319
수행원

다중 레벨 EMA 및 RSI 동적 잠재 강도를 기반으로 한 비트코인 ​​크로스 사이클 트렌드 거래 전략 다중 레벨 EMA 및 RSI 동적 잠재 강도를 기반으로 한 비트코인 ​​크로스 사이클 트렌드 거래 전략

개요

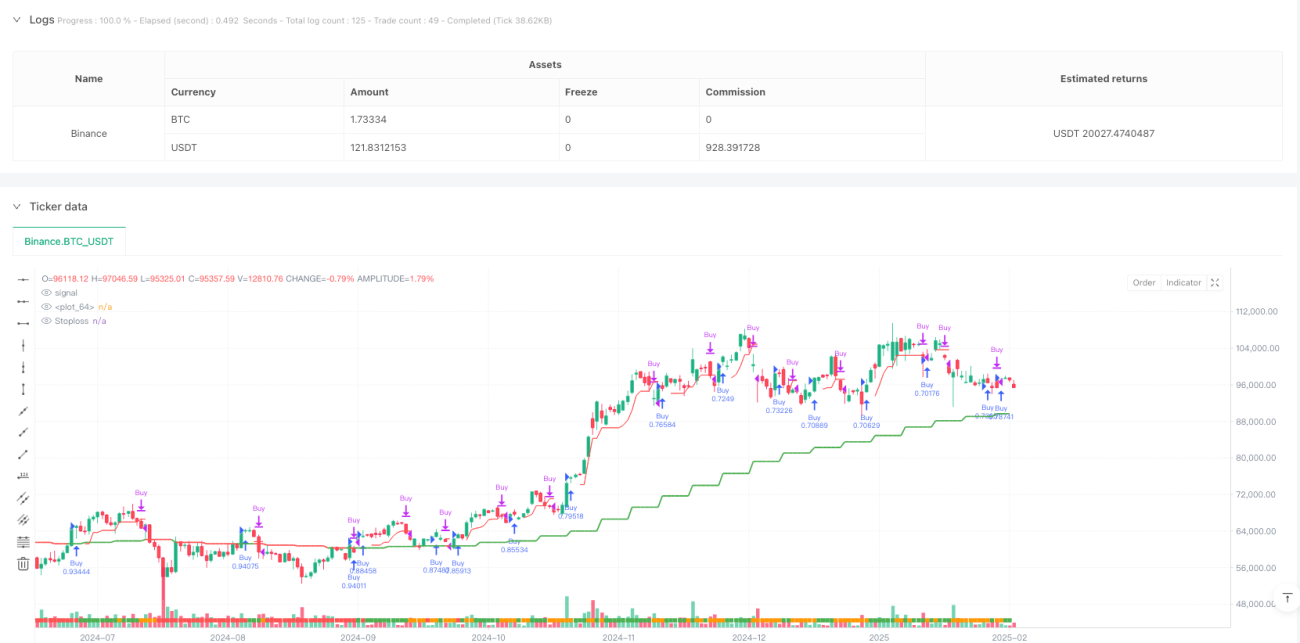
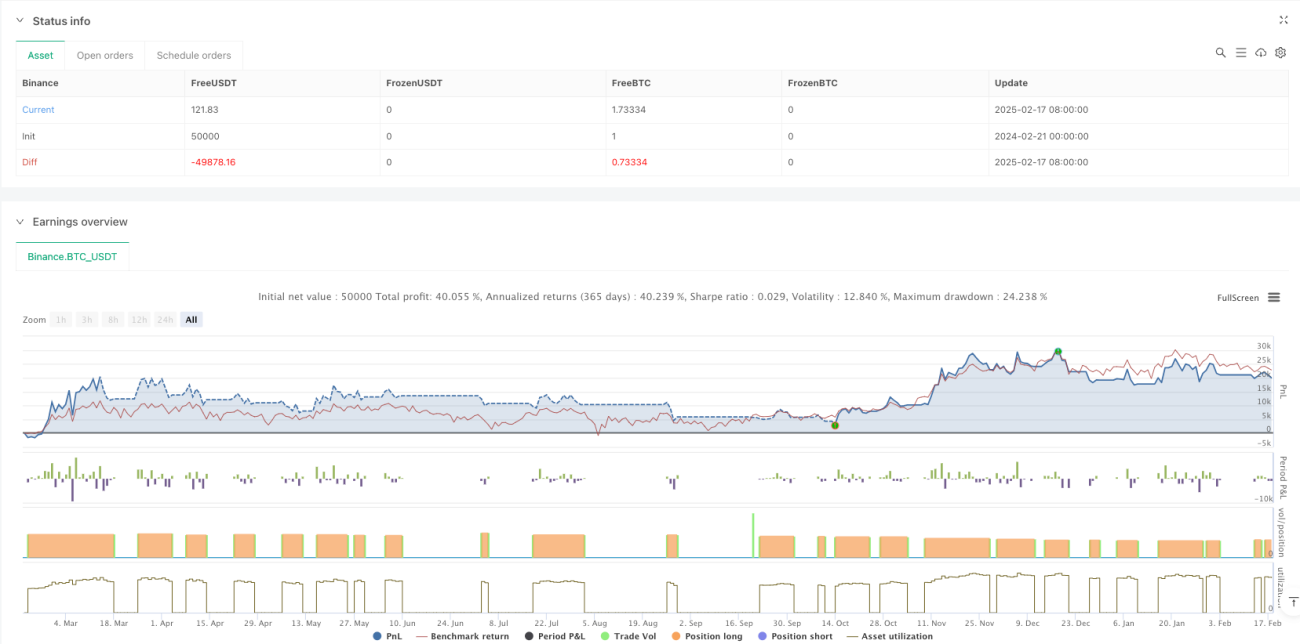
이 전략은 주간 및 일간 레벨의 EMA 평균선과 RSI 지표를 결합하여 시장의 추세와 동력을 식별하는 트렌드 추적 거래 시스템입니다. 전략은 여러 시간 프레임의 트렌드 일관성을 통해 거래 기회를 결정하고 ATR 기반의 동적 스톱로스를 사용하여 위험을 관리합니다. 시스템은 자금 관리 모드를 채택하여 거래 당 계좌의 100%를 사용하며 0.1%의 거래 수수료를 고려합니다.

전략 원칙

전략의 핵심 논리는 다음과 같은 핵심 요소에 기초합니다.

  1. 주간선 수준의 EMA를 주요 트렌드 필터로 사용하여, 일간선 종점 가격과 주간선 EMA의 관계를 결합하여 시장 상태를 결정합니다.
  2. ATR 지표의 동적 조정 트렌드를 통해 결정된 마이너스, 전략의 적응력을 높여
  3. 추가 거래 필터 조건으로 RSI 동력 지표를 통합합니다.
  4. 7일 최저 가격 및 ATR에 기반한 추적 중지 시스템
  5. 과도한 상승의 경고 신호가 발생했을 때, 전략은 위험을 피하기 위해 포지션을 잠정 중단합니다.

전략적 이점

  1. 다중 시간 프레임 분석은 가짜 돌파구를 효과적으로 필터링할 수 있는 더 포괄적인 시장 관점을 제공합니다.
  2. 다이내믹 스톱 메커니즘은 시장의 변동성에 따라 적응하여 유연한 위험 관리를 제공합니다.
  3. RSI 동력 필터는 트렌드 강도를 확인하고 입시 품질을 향상시킵니다.
  4. 과도한 중독에 대한 사전 경고 장치가 포함되어 있으며, 탈퇴의 위험을 회피하는 데 도움이 됩니다.
  5. 전략의 매개 변수는 다양한 시장 환경에 따라 최적화 할 수 있습니다.

전략적 위험

  1. 수평 시장에서 거래 비용이 증가할 수 있는 빈번한 출입
  2. 100% 자금으로 거래하는 경우 회수 위험이 높습니다.
  3. 기술 지표에 의존하는 경우 시장의 갑작스러운 사건에 대한 반응이 늦어질 수 있습니다.
  4. 다중 시간 프레임 분석은 다양한 수준에서 모순된 신호를 나타낼 수 있습니다.
  5. 트래킹 스톱은 급격한 변동이 있을 때 조기 시작될 수 있습니다.

전략 최적화 방향

  1. 변동율 필터를 도입하여 낮은 변동율의 기간 동안 거래 빈도를 줄입니다.
  2. 포지션 관리 시스템을 추가하여 시장 상황에 따라 포지션 비율을 조정합니다.
  3. 기본 지표를 통합하여 추가 시장 상황을 판단합니다.
  4. 다른 시장 단계에 더 잘 적응하도록 스톱 손실 파라미터를 최적화
  5. 트렌드 판단의 정확성을 높이기 위해 거래량 분석을 추가합니다.

요약하다

이것은 구조가 완전하고, 논리가 명확한 트렌드 추적 전략이다. 전략은 여러 시간 프레임 분석과 동적 지표 필터링을 통해 주요 트렌드를 더 잘 포착할 수 있다. 일부 고유한 위험이 있지만, 매개 변수를 최적화하고 추가 지표를 추가함으로써 전략에는 여전히 큰 개선의 여지가 있다. 실물 거래 전에 충분한 피드백을 수행하고 특정 시장 환경에 따라 매개 변수 설정을 조정하는 것이 좋습니다.

전략 소스 코드
/*backtest
start: 2024-02-21 00:00:00
end: 2025-02-18 08:00:00
period: 1d
basePeriod: 1d
exchanges: [{"eid":"Binance","currency":"BTC_USDT"}]
*/

// @version=6
strategy("Bitcoin Regime Filter Strategy",         // Strategy name
     overlay=true,                                 // The strategy will be drawn directly on the price chart
     initial_capital=10000,                        // Initial capital of 10000 USD
     currency=currency.USDT,                       // Defines the currency used, USDT
     default_qty_type=strategy.percent_of_equity,  // Position size will be calculated as a percentage of equity
     default_qty_value=100,                        // The strategy uses 100% of available capital for each trade
     commission_type=strategy.commission.percent,  // The strategy uses commission as a percentage
     commission_value=0.1)                         // Transaction fee is 0.1%

// User input 
res = input.timeframe(title = "Timeframe", defval = "W")                     // Higher timeframe for reference
len = input.int(title = "EMA Length", defval = 20)                           // EMA length input
marketTF = input.timeframe(title = "Market Timeframe", defval = "D")         // Current analysis timeframe (D)
useRSI = input.bool(title = "Use RSI Momentum Filter", defval = false)       // Option to use RSI filter
rsiMom = input.int(title = "RSI Momentum Threshold", defval = 70)            // RSI momentum threshold (default 70)

// Custom function to output data
f_sec(_market, _res, _exp) => request.security(_market, _res, _exp[barstate.isrealtime ? 1 : 0])[barstate.isrealtime ? 0: 1]

// The f_sec function has three input parameters: _market, _res, _exp
// request.security = a Pine Script function to fetch market data, accessing OHLC data
// _exp[barstate.isrealtime ? 1 : 0] checks if the current bar is real-time, and retrieves the previous bar (1) or the current bar (0)
// [barstate.isrealtime ? 0 : 1] returns the value of request.security, with a real-time check on the bar

// Define time filter
dateFilter(int st, int et) => time >= st and time <= et
// The dateFilter function has two input parameters: st (start time) and et (end time)
// It checks if the current bar's time is between st and et

// Fetch EMA value
ema = ta.ema(close, len)                                   // Calculate EMA with close prices and input length
htfEmaValue = f_sec(syminfo.tickerid, res, ema)            // EMA value for high time frame, using f_sec function

// Fetch ATR value
atrValue = ta.atr(5)

// Check if price is above or below EMA
marketPrice = f_sec(syminfo.tickerid, marketTF, close)
regimeFilter = marketPrice > (htfEmaValue + (atrValue * 0.25))       // Compare current price with EMA in higher timeframe (with ATR dependency)

// Calculate RSI value
rsiValue = ta.rsi(close, 7)

// Bullish momentum filter
bullish = regimeFilter and (rsiValue > rsiMom or not useRSI)

// Set caution alert
caution = bullish and (ta.highest(high, 7) - low) > (atrValue * 1.5)

// Set momentum background color
bgCol = color.red
if bullish[1]
    bgCol := color.green
if caution[1]
    bgCol := color.orange

// Plot background color
plotshape(1, color = bgCol, style = shape.square, location = location.bottom, size = size.auto, title = "Momentum Strength")
plot(htfEmaValue, color = close > htfEmaValue ? color.green : color.red, linewidth = 2)

// Initialize trailing stop variable
var float trailStop = na

// Entry logic
if bullish and strategy.position_size == 0 and not caution
    strategy.entry(id = "Buy", direction = strategy.long)
    trailStop := na

// Trailing stop logic
temp_trailStop = ta.highest(low, 7) - (caution[1] ? atrValue * 0.2 : atrValue)
if strategy.position_size > 0
    if temp_trailStop > trailStop or na(trailStop)
        trailStop := temp_trailStop

// Exit logic
if (close < trailStop or close < htfEmaValue)
    strategy.close("Buy", comment = "Sell")

// Plot stop loss line
plot(strategy.position_size[1] > 0 ? trailStop : na, style = plot.style_linebr, color = color.red, title = "Stoploss")