다중 레벨 RSI 교차 회귀 전략

2
Follow
478
Followers
개요
이 전략은 상대적으로 강한 지표 ((RSI) 를 기반으로 한 자동화 된 거래 시스템으로, 시장의 과매매 조건을 식별하여 잠재적인 반발 기회를 잡습니다. 이 전략은 점진적 인 포지션 구축 방식을 채택하고, RSI 낮은 지점이 교차 할 때 단계적으로 여러 포지션을 구축하고, 수익 목표를 설정하여 위험을 제어합니다. 시스템은 유연한 자금 관리 장치를 설계하여 매 거래 당 계좌 총액의 6.6%를 사용하며, 최대 15 개의 피라미드 포지션을 허용합니다.
전략 원칙
전략의 핵심 논리는 다음과 같은 핵심 요소에 기초합니다.
- 입문 신호: 14주기 RSI 아래 28.5의 초과 판매 수준을 넘어서면 구매 신호를 유발합니다.
- 포지션 관리: 단일 포지션 사용 계정의 6.6%, 최대 15 개의 포지션이 허용됩니다.
- 이윤이 나왔습니다: 가격이 900%의 평균시장 가격 상승에 도달했을 때 50%의 지분을 매각했습니다.
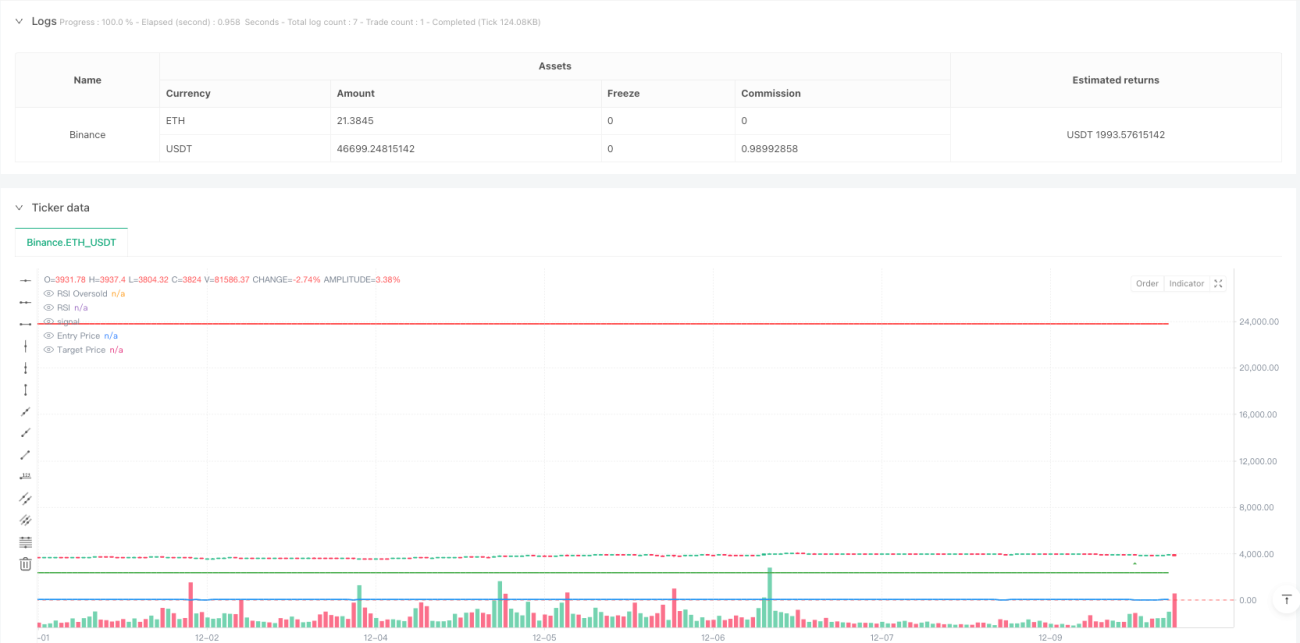
- 시각적 표시: 차트 상에서 구매/판매 신호, RSI 곡선, 출입 가격 및 목표 가격으로 표시
전략은 RSI 지표가 과매매 지역에서 어떻게 보이는지를 관찰하여 시장의 움직임을 판단하고, 과매매 신호가 발생하면 단계적으로 포지션을 구축하여 포지션 구축 비용을 절감한다.
전략적 이점
- 체계적인 포지션 구축: RSI 파라미터를 통해 거래 기회를 자동으로 식별하여 인위적인 판단으로 인한 주관적 편향을 피합니다.
- 위험 분산: 순차적인 포지션 구축 방식을 사용하여 다양한 가격에 여러 포지션을 구축하여 위험을 효과적으로 분산합니다.
- 유연한 적응력: 다양한 시장 환경과 개인 위험 선호도에 따라 전략 매개 변수를 조정할 수 있습니다.
- 수익 보호: 명확한 수익 목표가 설정되어 목표가 달성되면 자동으로 지분을 줄이고 수익의 일부를 잠금합니다.
- 자금 효율성: 합리적인 포지션 제어 및 가증 메커니즘을 통해 자금 사용 효율성을 높인다.
전략적 위험
- 트렌드 위험: 강력한 하향 트렌드 중에 자주 포지션 신호를 유발하여 자금 손실을 초래할 수 있습니다.
- 매개 변수 민감: RSI 매개 변수, 포지션 비율 등의 부적절한 설정이 전략 성능에 영향을 미칠 수 있다
- 시장 유동성: 유동성이 부족한 시장에서 목표 가격에 거래하는 것이 어려울 수 있습니다.
- 자금 관리: 과도한 포지셔닝으로 인해 과대한 리스크 포털이 발생할 수 있다
해결책:
- 트렌드 필터를 추가하고, 하향 추세에 대한 명확한 입지를 중지합니다.
- 역측정으로 최적화 변수 설정
- 최대 회수 제한을 설정
- 동적으로 조정된 부가가치
전략 최적화 방향
- 동적 변수: 시장의 변동에 따라 RSI 변수와 포지션 조건을 자동으로 조정합니다
- 손해 차단 장치: 모바일 손해 차단 기능을 추가하여 위험을 더 잘 제어합니다.
- 시장 필터링: 거래량, 트렌드 등의 필터링 조건을 추가하여 신호 품질을 향상시킵니다.
- 출장 최적화: 분기 하락과 같은 더 유연한 수익 결제 장치를 설계하십시오.
- 위험 제어: 최대 철수 제한과 위험 <unk> 컨트롤을 증가
요약하다
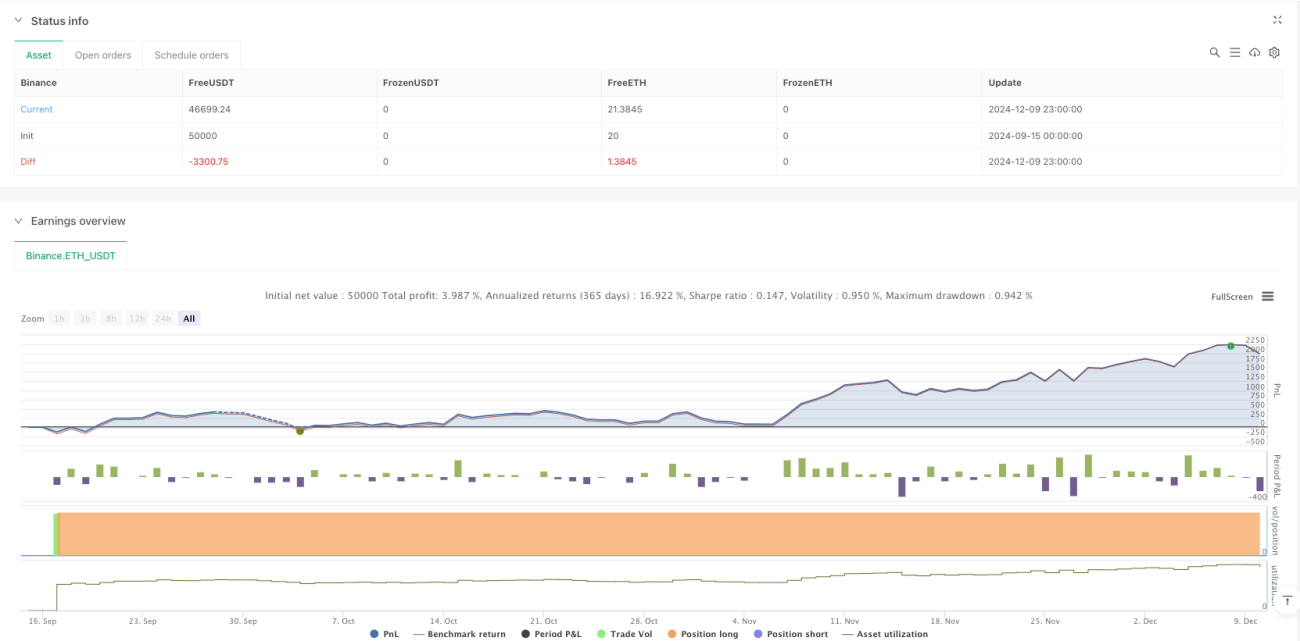
이 전략은 RSI 지표를 통해 과매매 기회를 식별하고, 피라미드형 가축과 고정 비율을 결합하여 수익을 창출하며, 완전한 거래 시스템을 구축한다. 전략의 장점은 체계적인 운영과 위험 분산에 있다. 그러나 시장 추세와 매개 변수 설정이 전략의 성과에 미치는 영향을 주의해야 한다. 동적 매개 변수 조정, 손해 방지 장치 및 시장 필터링과 같은 최적화 조치를 추가함으로써 전략의 안정성과 수익성을 더욱 향상시킬 수 있다.
Source
Pine
/*backtest
start: 2024-09-15 00:00:00
end: 2024-12-10 00:00:00
period: 1h
basePeriod: 1h
exchanges: [{"eid":"Binance","currency":"ETH_USDT"}]
*/

//@version=5
strategy("RSI Cross Under Strategy", overlay=true, initial_capital=1500, default_qty_type=strategy.percent_of_equity, default_qty_value=6.6)

// Input parametersStrategy parameters
Related strategies
Comment
All comments (0)
No data
- 1