MACD 히스토그램을 기반으로 한 모멘텀 다이버전스 추세 반전 정량적 전략

개요
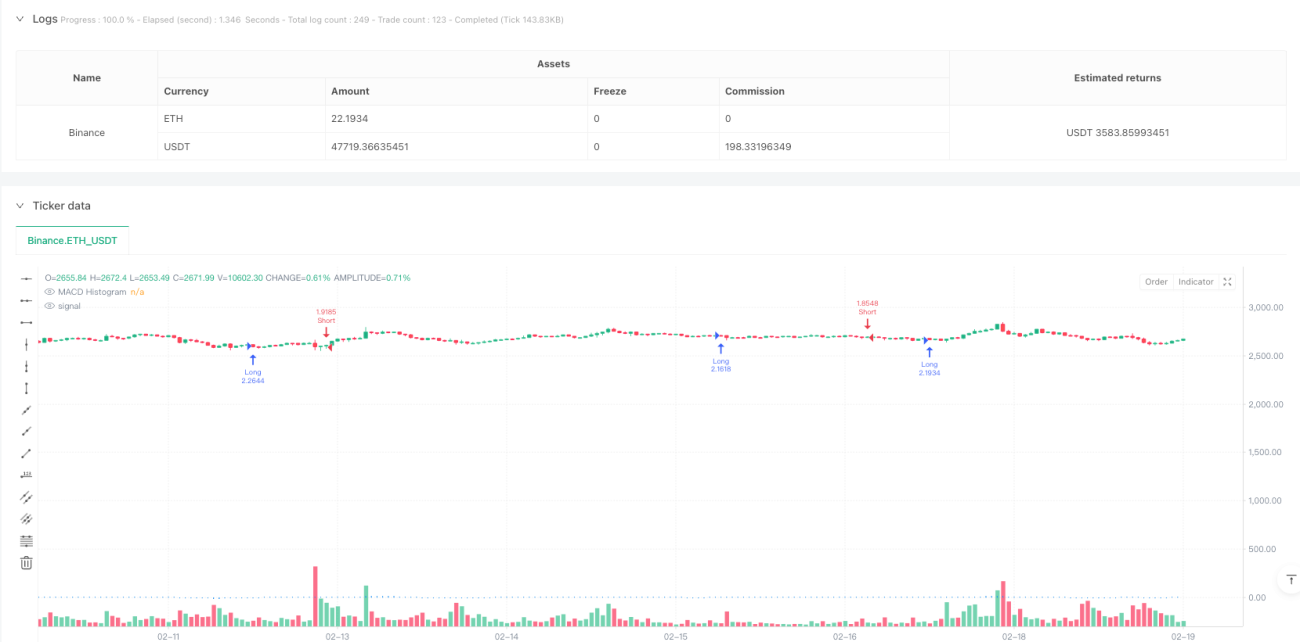
이 전략은 MACD 기둥 도표의 역동량에서 벗어난 트렌드 역전 거래 시스템이다. K선 모양의 변화와 MACD 기둥 도표의 역동량 변화 사이의 관계를 분석하여 시장 역전 신호를 포착한다. 전략의 핵심 아이디어는 시장에서 역동량 쇠퇴의 징후가 발생했을 때 역전 거래를 수행하여 추세가 반전될 때 미리 배열한다.
전략 원칙
이 전략의 거래 논리는 두 가지 방향으로 나뉘어져 있습니다.
공백 조건: 큰 선이 나타나면 (폐쇄 가격이 개장 가격보다 높으며), 그 실체는 전의 K 선보다 크며, MACD 기둥 모양의 도표가 연속으로 3 회 동안 하향 경향을 나타내면, 상향 변동력이 약화되고 있음을 나타냅니다. 시스템 공백 신호를 냅니다.
다중 조건: 큰 음선이 나타났을 때 (폐쇄 가격이 오픈 가격보다 낮다) 그리고 그 실체는 전의 K선보다 크며, MACD 기둥 모양의 도표가 연속적으로 3 회 동안 상승 추세를 나타냈을 때, 하향 움직임이 약화되고 있다는 것을 나타냅니다. 시스템은 다중 신호를 냅니다.
포지션 관리는 상대의 신호 평소 포지션 메커니즘을 채택합니다. 즉, 반대 방향으로 거래 신호가 발생하면 현재 포지션을 평소합니다. 전략은 중지 손실과 정지를 설정하지 않고 신호에 전적으로 의존하여 포지션을 관리합니다.
전략적 이점
- 신호 명확성: 전략은 K선 형태와 기술 지표를 동시에 고려하여 더 신뢰할 수 있는 거래 신호를 제공합니다.
- 역전환 포착: 역전환 변화를 모니터링하여 시장의 전환점을 더 일찍 발견할 수 있다.
- 위험 조절: 상대 신호 평준화 메커니즘을 적용하여 추세가 변할 때 불리한 위치를 계속 유지하지 않습니다.
- 거래 규칙이 명확하고, 실행 및 회귀가 쉽다.
- 적응력: 전략은 다른 시장과 시간 주기에도 적용될 수 있다.
전략적 위험
- 가짜 브레이크 위험: 시장에서 가짜 브레이크가 발생할 수 있으며, 이는 잘못된 신호로 이어질 수 있다.
- 흔들림 시장 위험: 수평 변동 시장에서, 빈번한 트렌드 전환은 연속적인 손실을 초래할 수 있다.
- 슬라이드 포인트 위험: 유동성이 부족할 때 큰 거래는 눈에 띄는 슬라이드 포인트에 직면할 수 있습니다.
- 과도한 거래 위험: 신호가 더 자주 발생하여 거래 비용이 더 높을 수 있습니다.
- 시장 환경 의존: 전략은 트렌딩 시장에서 잘 작동하지만 다른 시장 환경에서는 효과가 좋지 않을 수 있습니다.
전략 최적화 방향
- 트렌드 필터 도입: 동선 시스템과 같은 트렌드 판단 지표를 추가하여 위조 시장의 가짜 신호를 필터링한다.
- 최적화된 스톱 메커니즘: 합리적인 스톱 포지션을 설정하고, 단일 위험을 제어한다.
- 정지 메커니즘을 개선: 시장의 변동적 동력에 따라 수익을 얻는 결점 지점.
- 거래 필터링 조건을 추가: 거래량 확인, 변동률 필터링 등으로 신호 품질을 향상한다.
- 포지션 관리를 최적화: 동적 포지션 관리 메커니즘을 도입하여 시장 상황에 따라 포지션 비율을 조정한다.
요약하다
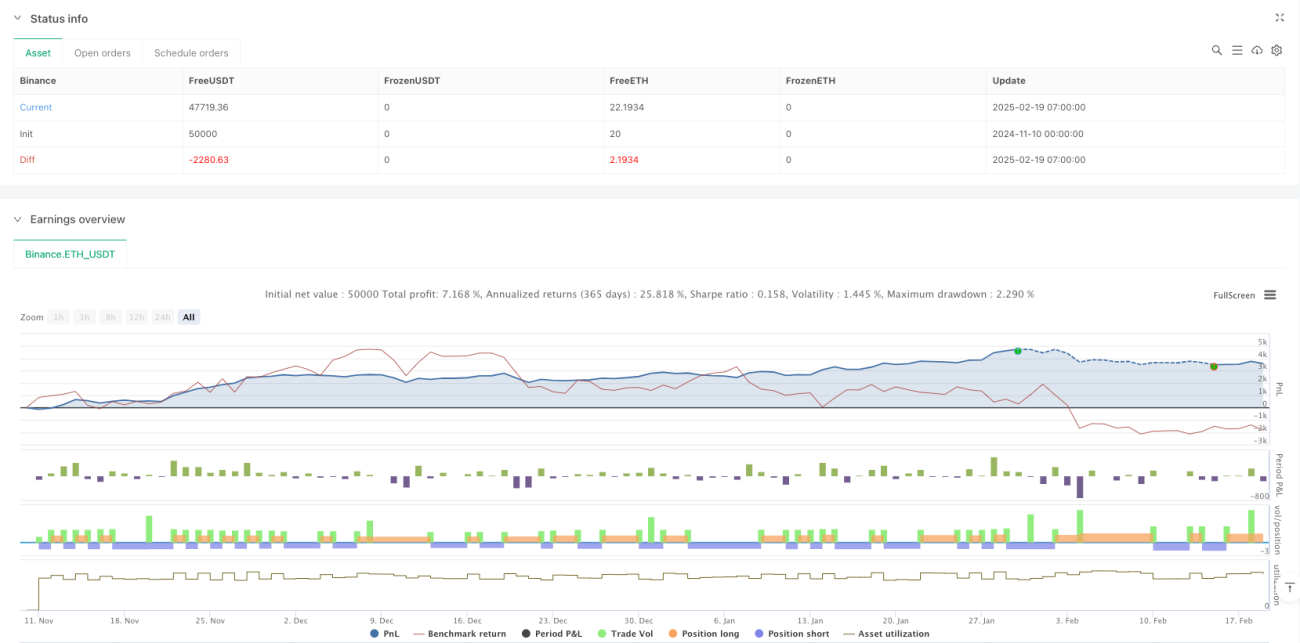
이 전략은 K선 형태와 MACD 기둥 모양의 동적량 변화를 결합하여 시장 역전 기회를 포착하기 위해 운영이 간단하고 신호가 명확한 특징이 있다. 일정 위험이 존재하지만 합리적인 최적화 및 위험 관리 조치를 통해 전략의 안정성과 수익성을 크게 향상시킬 수 있다. 전략은 특히 추세가 명백한 시장 환경에 적합하며 거래 시스템의 중요한 구성 요소로 사용될 수 있다.
/*backtest
start: 2024-11-10 00:00:00
end: 2025-02-19 08:00:00
period: 1h
basePeriod: 1h
exchanges: [{"eid":"Binance","currency":"ETH_USDT"}]
*/

//@version=5
strategy("MACD Momentum Reversal Strategy", overlay=true, initial_capital=100000, default_qty_type=strategy.percent_of_equity, default_qty_value=10)

// === MACD Calculation ===- 1