
2
Follow
478
Followers
개요
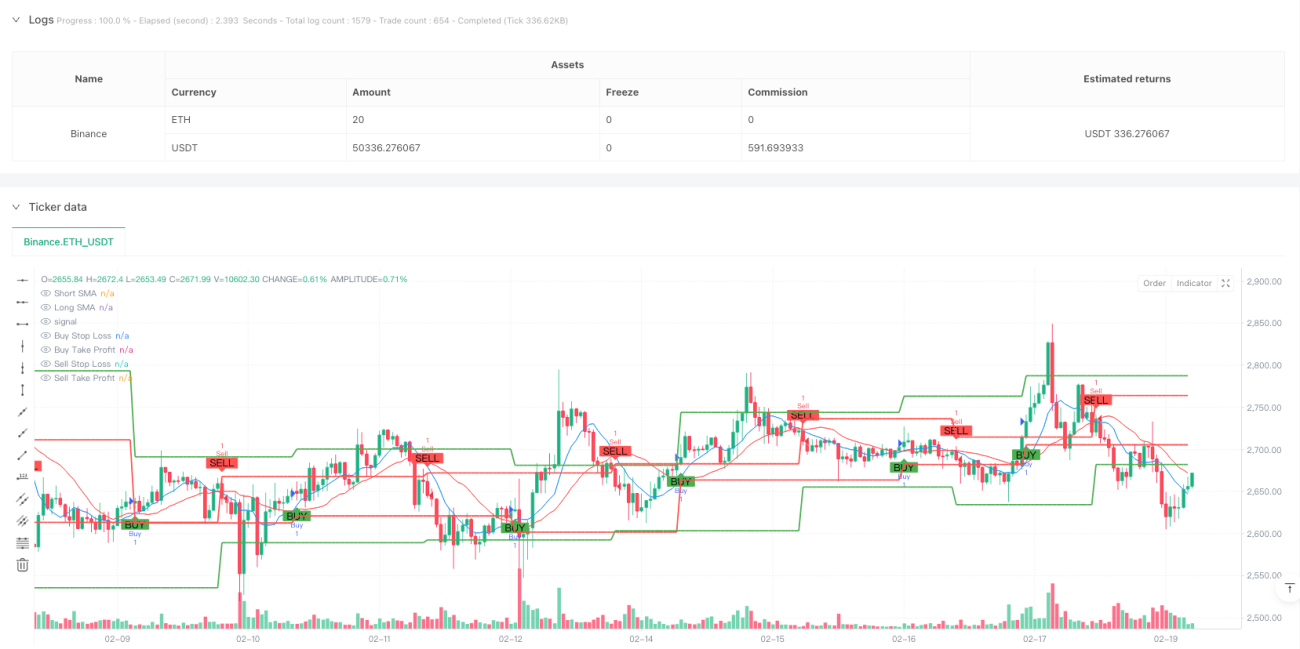
이 시스템은 단기 및 장기 간 간단한 이동 평균 ((SMA) 을 사용하여 거래 신호를 생성하고, 위험을 제어하기 위해 중지 및 중지 기능을 통합합니다. 이 전략은 백분율 위험 관리 방법을 채택하여 계정 자금의 동력에 따라 지분 규모를 조정하여 거래 프로세스를 자동화하고 지능화합니다.
전략 원칙
이 전략은 다음과 같은 핵심 원칙에 기초하고 있습니다.
- 9일과 21일 두 개의 간단한 이동 평균 ((SMA) 의 교차를 사용하여 시장의 추세를 잡습니다. 단기 평균이 장기 평균을 상향으로 통과하면 다중 신호가 발생하고 단기 평균이 장기 평균을 하향으로 통과하면 마이너스 신호가 발생합니다.
- 계정 적당금 기반의 동적 리스크 관리 시스템을 채택한다. 각 거래의 리스크 금액은 계정 적당금의 1%로 고정되며, 중지 손실은 입시 가격의 1%로 설정되며, 중지 손실은 중지 손실 거리의 2배로 설정된다.
- 전략은 거래 규모를 자동으로 계산하여 각 거래의 위험 금액이 항상 미리 설정된 수준에 유지되도록 합니다.
전략적 이점
- 신호 시스템은 간단하고 안정적입니다: 고전적인 쌍평선 교차 시스템을 사용하여 이해하기 쉽고 유지 관리하기 쉽습니다.
- 완벽한 위험 제어: 거래 당 최대 손실을 제한하는 통합된 중지 및 중지 기능.
- 동적 포지션 관리: 계정 권익에 따라 거래 규모를 자동으로 조정하여 고정 수 거래로 인한 위험을 피한다.
- 강력한 시각화 효과: 거래 신호, 중지 및 중지 수준을 차트에 명확하게 표시하여 모니터링 및 분석을 용이하게합니다.
- 매개 변수 조정성: 주요 매개 변수는 입력 인터페이스를 통해 조정할 수 있으며, 다양한 시장 환경에 적응할 수 있다.
전략적 위험
- 흔들림 시장 위험: 가로 수평 흔들림 상황에서 가짜 브레이크 신호가 자주 발생할 수 있으며, 이로 인해 연속적인 스톱 손실이 발생할 수 있습니다.
- 슬라이드 포인트 위험: 시장이 급격하게 변동할 때, 실제 거래 가격은 이론 가격과 큰 편차가 있을 수 있다.
- 시스템적 위험: 시장이 급등하거나 중대한 사건이 발생했을 때, 손실을 막는 것은 무효가 될 수 있다.
- 변수 최적화 위험: 지나치게 최적화 된 변수들은 전략이 실판에서 제대로 작동하지 않도록 만들 수 있다.
전략 최적화 방향
- 트렌드 필터를 추가: ADX와 같은 트렌드 지표를 추가하여 강한 트렌드 상황에서 거래 할 수 있습니다.
- 손해의 최적화 방법: 변동률을 사용하여 적응하는 동적 손해를 고려할 수 있으며, 손해의 유연성을 높일 수 있다.
- 거래량 지표 도입: 거래량 분석을 결합하여 거래 신호의 신뢰성을 높인다.
- 시간 필터를 추가: 큰 변동이 있는 개시 및 종료 시간에 거래하는 것을 피하십시오.
- 더 많은 철수 제어: 최대 철수 제한을 설정하고, 손실이 특정 수준에 도달하면 자동으로 거래를 중단한다.
요약하다
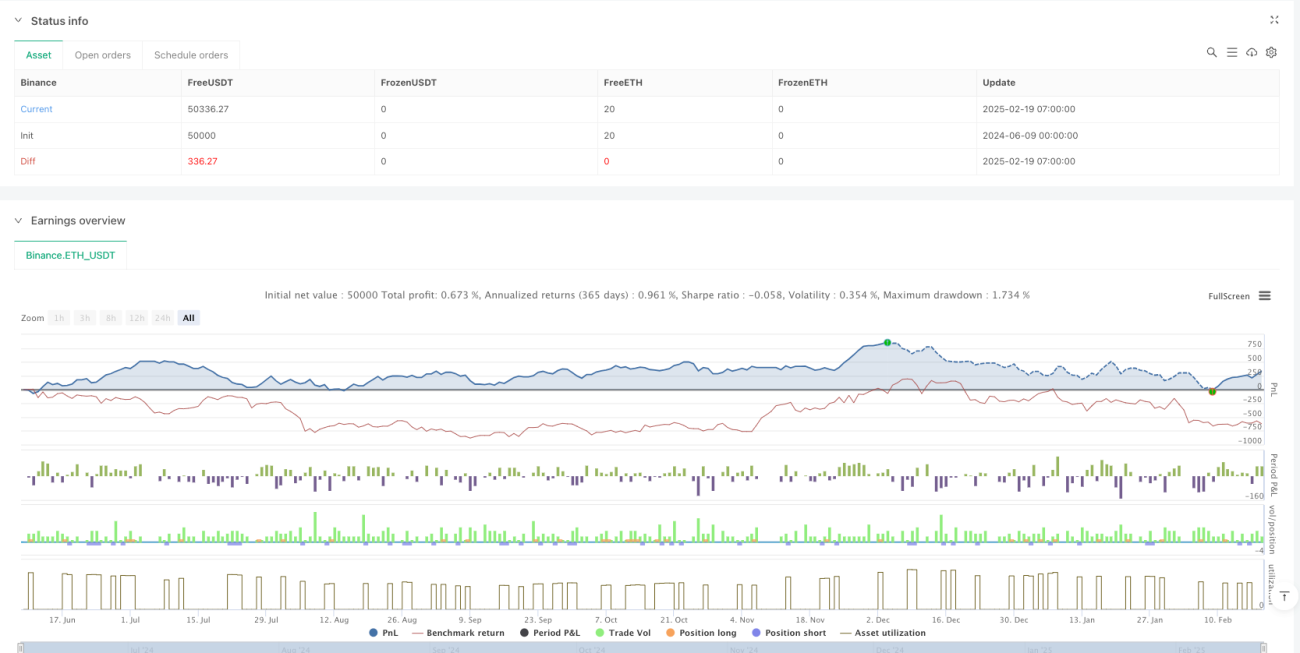
이것은 고전적인 기술 분석 방법을 현대적 위험 관리 개념과 결합한 지능적인 거래 시스템이다. 동적 위험 관리 제어 트렌드를 활용하여 동적 위험 관리, 트레이드의 자동화 실행을 실현한다. 시스템이 여전히 최적화해야 할 부분이 있지만 전체적인 설계 개념은 선진적이며 실용적인 가치가있다.
Source
Pine
Strategy parameters
Related strategies
Comment
All comments (0)
No data
- 1