개요
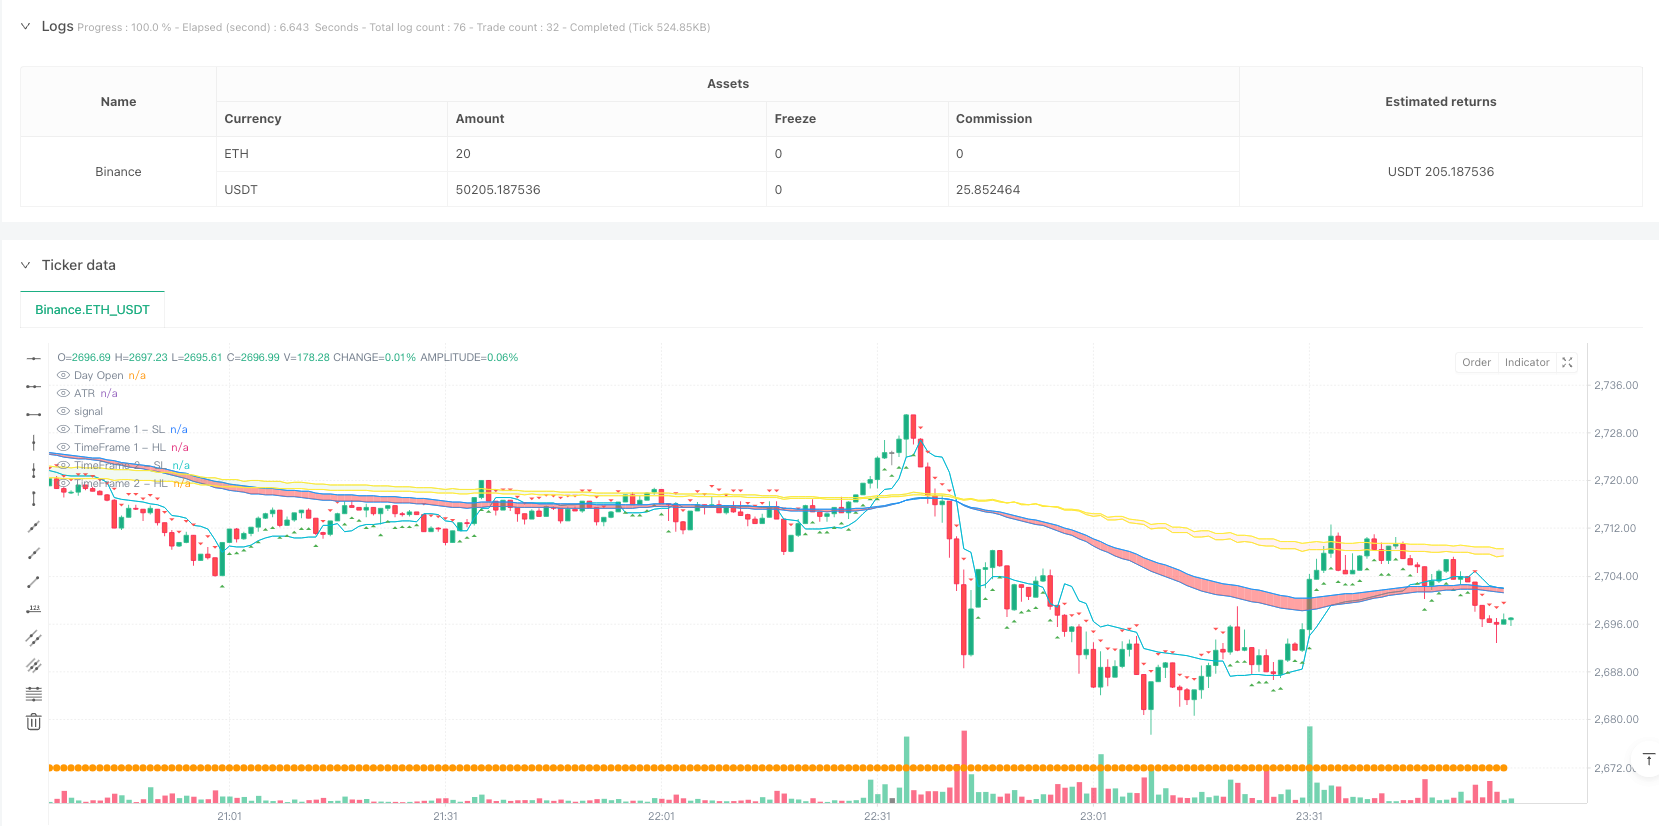
이것은 여러 기술 지표를 결합한 지능형 거래 전략이며, 주로 ATR 지표를 기반으로 중지 손실을 추적하는 기능을 구현한다. 전략은 평평선 클라우드 (JLines Cloud), 거래량 분석 및 일일 오픈 가격과 같은 다차원 분석 지표를 통합하고, 특히 3 분 및 5 분 시간 주기에서 거래하기에 적합하다. 이 전략은 ATR을 통해 중지 손실 위치를 동적으로 조정하고, 평평선 시스템과 함께 추세를 판단하여 전체적인 거래 의사 결정 시스템을 구현한다.
전략 원칙
전략의 핵심은 ATR (평균 실제 파도) 지표에 기반한 추적 스톱 시스템이다. 그것은 10주기 ATR과 2배의 ATR 곱수를 사용하여 동적 스톱 라인을 계산한다. 동시에 두 시간 주기 JLines Cloud 시스템 (72⁄89 평선 조합) 과 선택 가능한 5⁄15 평선 시스템을 통합한다. 거래 신호의 발생은 다음과 같은 조건을 충족해야합니다.
- ATR이 스탠드 라인 돌파를 추적한다
- JLines 클라우드 트렌드는 두 시간대에서 일치합니다.
- 하루의 오픈 가격에 대한 가격의 위치
- 비정상적인 거래량 확인
전략적 이점
- 다이내믹 스톱 로즈 보호 - ATR 지표를 통해 시장의 변동에 적응하여 유연한 스톱 로즈 보호
- 다차원 트렌드 확인 - 다른 시간 주기의 평균선 조합을 사용하여 트렌드 판단의 정확성을 향상시킵니다.
- 거래량 검증 - 비정상적인 거래량 분석을 통해 거래 확인을 증가시킵니다.
- 리스크 관리가 잘 이루어져 있습니다. 고정된 손실과 수익 목표를 포함하는 이중 보호 장치입니다.
- 유연성 - 다른 시장 조건에 따라 변수를 조정할 수 있습니다.
전략적 위험
- 매개 변수 감수성 - ATR 주기 및 배수의 선택이 전략 성능에 중대한 영향을 미칩니다.
- 시장 조건 의존성 - 가로판 시장에서 빈번하게 잘못된 신호가 발생할 수 있습니다.
- 복합 조건 제한 - 엄격한 입시 조건으로 인해 일부 거래 기회를 놓칠 수 있습니다.
- 슬라이드 포인트 영향 - 높은 변동성 기간 동안 실제 실행 가격은 신호 가격과 큰 오차가있을 수 있습니다.
전략 최적화 방향
- 동적 변수 조정 - 시장의 변동성에 따라 ATR 변수를 자동으로 조정할 수 있습니다.
- 시간 필터 - 거래 시간 필터를 추가하여 시장 개시 및 종료의 높은 변동기를 피합니다.
- 트렌드 강도 필터 - 트렌드 강도 지표를 도입하여 트렌드 판단의 정확성을 향상시킵니다.
- 리스크 관리 최적화 - 동적인 스톱 스톱 손실 비율을 구현하여 다양한 시장 환경에 적응
- 거래량 분석 강화 - 거래량 분석 방법을 정교화하여 거래 확인의 정확도를 향상시킵니다.
요약하다
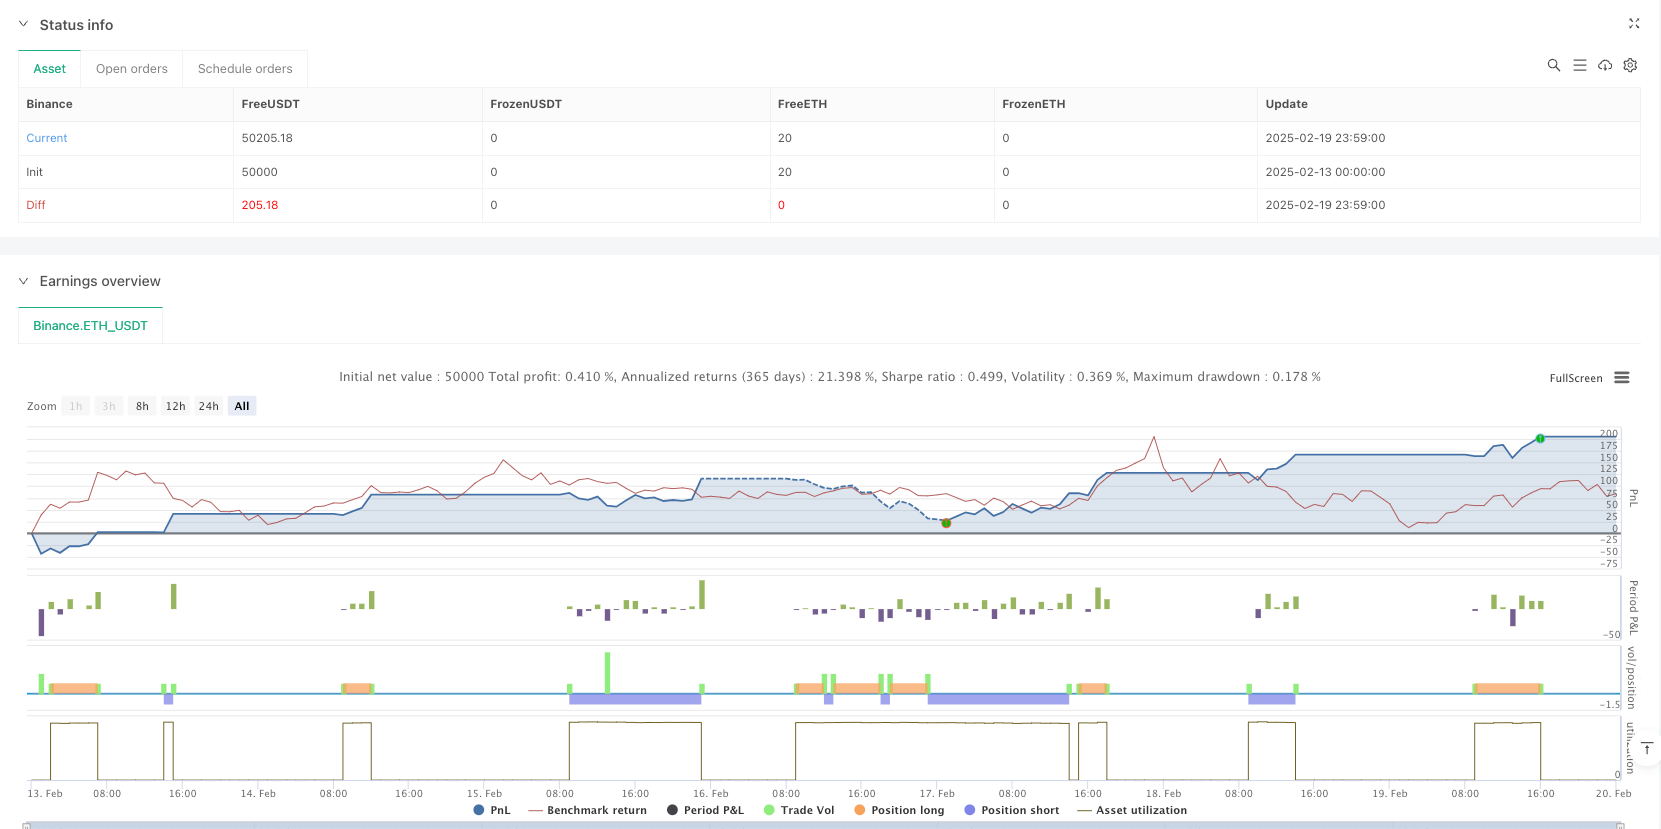
이것은 여러 기술 지표들을 결합한 완전한 거래 시스템이며, ATR 추적을 통해 핵심 위험 관리를 제공하며, 평평한 클라우드 및 거래량 분석을 사용하여 거래 확인을 제공합니다. 전략의 장점은 포괄적인 시장 분석 프레임워크와 완벽한 위험 관리 시스템이지만, 특정 시장 환경에 대한 파라미터 최적화가 필요합니다. 제안된 최적화 방향에 의해 전략의 안정성과 수익성이 더욱 향상될 것으로 예상됩니다.
전략 소스 코드
/*backtest
start: 2025-02-13 00:00:00
end: 2025-02-20 00:00:00
period: 1m
basePeriod: 1m
exchanges: [{"eid":"Binance","currency":"ETH_USDT"}]
*/

//@version=6
strategy("AI trade Roney nifty value", overlay=true)

// User Inputs
atrPeriod = input.int(10, "ATR Period")
atrMultiplier = input.float(2, "ATR Multiplier")
target = input.float(40, "Target")
stopLoss = input.float(40, "Stop Loss")

// Calculate ATR-based trailing stop
atr = ta.atr(atrPeriod)
nLoss = atrMultiplier * atr
var float xATRTrailingStop = na

if na(xATRTrailingStop)
    xATRTrailingStop := close - nLoss
else
    if close > xATRTrailingStop[1] and close[1] > xATRTrailingStop[1]
        xATRTrailingStop := math.max(xATRTrailingStop[1], close - nLoss)
    else if close < xATRTrailingStop[1] and close[1] < xATRTrailingStop[1]
        xATRTrailingStop := math.min(xATRTrailingStop[1], close + nLoss)
    else
        xATRTrailingStop := close > xATRTrailingStop[1] ? close - nLoss : close + nLoss

// Define position and entry/exit prices
var int pos = na
pos := close[1] < xATRTrailingStop[1] and close > xATRTrailingStop[1] ? 1 :
       close[1] > xATRTrailingStop[1] and close < xATRTrailingStop[1] ? -1 : pos[1]

var bool isLong = false
var bool isShort = false

var float entryPrice = na
var float exitPrice = na
var float exitStop = na

// JLines Cloud indicator
sl = input.int(72, "Smaller length")
hl = input.int(89, "Higher length")

res = input.timeframe("1", "JLines - Time Frame 1")
res1 = input.timeframe("3", "JLines - Time Frame 2")
enable515 = input.bool(false, "5/15 EMA")
res2 = input.timeframe("5", "5/15 EMA")

ema1_72 = request.security(syminfo.tickerid, res, ta.ema(close, sl))
ema1_89 = request.security(syminfo.tickerid, res, ta.ema(close, hl))
ema2_72 = request.security(syminfo.tickerid, res1, ta.ema(close, sl))
ema2_89 = request.security(syminfo.tickerid, res1, ta.ema(close, hl))
ema3_5 = request.security(syminfo.tickerid, res2, ta.ema(close, 5))
ema3_15 = request.security(syminfo.tickerid, res2, ta.ema(close, 15))

// Plot JLines Cloud
p1_1 = plot(ema1_72, "TimeFrame 1 - SL", color=color.blue, display=display.none)
p1_2 = plot(ema1_89, "TimeFrame 1 - HL", color=color.blue, display=display.none)
p2_1 = plot(ema2_72, "TimeFrame 2 - SL", color=color.yellow, display=display.none)
p2_2 = plot(ema2_89, "TimeFrame 2 - HL", color=color.yellow, display=display.none)
p3_1 = plot(enable515 ? ema3_5 : na, "Late Day Fade - 5 EMA", color=color.yellow, display=display.none)
p3_2 = plot(enable515 ? ema3_15 : na, "Late Day Fade - 15 EMA", color=color.yellow, display=display.none)

fill(p1_1, p1_2, color=ema1_72 > ema1_89 ? color.new(color.green, 30) : color.new(color.red, 30), title="Background 1")
fill(p2_1, p2_2, color=ema2_72 > ema2_89 ? color.new(color.green, 90) : color.new(color.red, 90), title="Background 2")
fill(p3_1, p3_2, color=enable515 ? (ema3_5 > ema3_15 ? color.new(color.blue, 50) : color.new(color.red, 50)) : na, title="Late Day Fade")

// Plot Buy and Sell signals
plotshape(pos == 1, title="Buy", style=shape.triangleup, location=location.belowbar, color=color.green)
plotshape(pos == -1, title="Sell", style=shape.triangledown, location=location.abovebar, color=color.red)

// Volume Analysis
vol_length = input.int(20, "Volume SMA length", minval=1)
vol_avg = ta.sma(volume, vol_length)

unusual_vol_down = volume > vol_avg * 1.2 and close < open
unusual_vol_up = volume > vol_avg * 1.2 and close > open

barcolor(unusual_vol_down or unusual_vol_up ? color.yellow : na)

// ATR Indicator
len2 = input.int(20, minval=1, title="Smooth")
src = input.source(close, title="Source")
out = ta.vwma(src, len2)
avg1 = math.avg(out, xATRTrailingStop) // FIXED: Replaced `ta.avg()` with `math.avg()`

plot(avg1, color=color.aqua, title="ATR")

// Daily Open Line
dl = input.bool(true, "Show daily Open")
dopen = request.security(syminfo.tickerid, "D", open)
plot(dl ? dopen : na, title="Day Open", color=color.orange, style=plot.style_circles, linewidth=2)

// Strategy Entry Conditions
if pos == 1 and not isLong and ema1_72 > ema1_89 and ema2_72 > ema2_89 and ema1_72 > ema2_72 and close > dopen
    entryPrice := close
    exitPrice := close + target
    exitStop := entryPrice - stopLoss
    strategy.entry("Buy", strategy.long)
    strategy.exit("buy_target", "Buy", limit=exitPrice)
    isLong := true
    isShort := false

if pos == -1 and not isShort and ema1_72 < ema1_89 and ema2_72 < ema2_89 and ema1_72 < ema2_72 and close < dopen
    entryPrice := close
    exitPrice := close - target
    exitStop := entryPrice + stopLoss
    strategy.entry("Sell", strategy.short)
    strategy.exit("Sell_target", "Sell", limit=exitPrice)
    isLong := false
    isShort := true

// Stop Loss Handling
if strategy.position_size > 0 and close < entryPrice - stopLoss
    strategy.close("Buy", comment="Buy_Stop Loss")

if strategy.position_size < 0 and close > entryPrice + stopLoss
    strategy.close("Sell", comment="Sell_Stop Loss")