
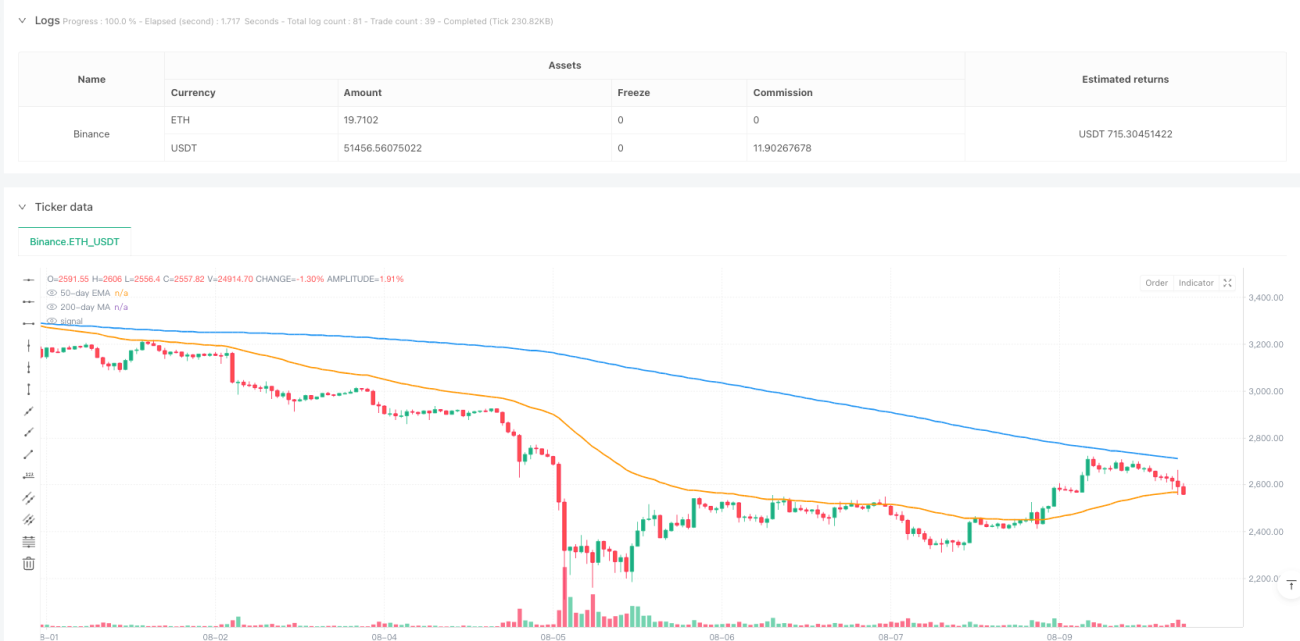
이 전략은 여러 기술 지표들을 결합한 트렌드 추적 동력 거래 시스템이다. 이 전략은 주로 200일 이동 평균 (MA200) 을 통해 큰 트렌드 방향을 판단하고, 50일 지수 이동 평균 (EMA50) 을 이용하여 역전 기회를 식별하고, 상대적으로 약한 지표 (RSI) 와 이동 평균 (MACD) 의 트렌드 분산 (Trend Scatter) 의 교차 신호를 결합하여 진입 시기를 결정한다. 이 전략은 또한 위험 통제 메커니즘을 포함하고 있으며, 위험 수익률과 추적을 설정하여 수익을 보호한다.
전략의 핵심 논리는 다층 필터링 메커니즘을 통해 거래의 정확성을 높이는 것입니다. 우선 MA200을 통해 시장 주류를 결정하고 MA200 이상의 가격으로 다중 트렌드, 반대로 상향 트렌드를 판단합니다. 트렌드 방향을 결정한 후, 전략은 EMA50 인근의 회수 기회를 찾고, 최근 5 주기에 EMA50을 접촉하도록 요구합니다. 동시에, RSI 지표를 사용하여 움직임을 확인하고, RSI가 50보다 크거나 RSI가 50보다 작거나 RSI를 요구합니다.
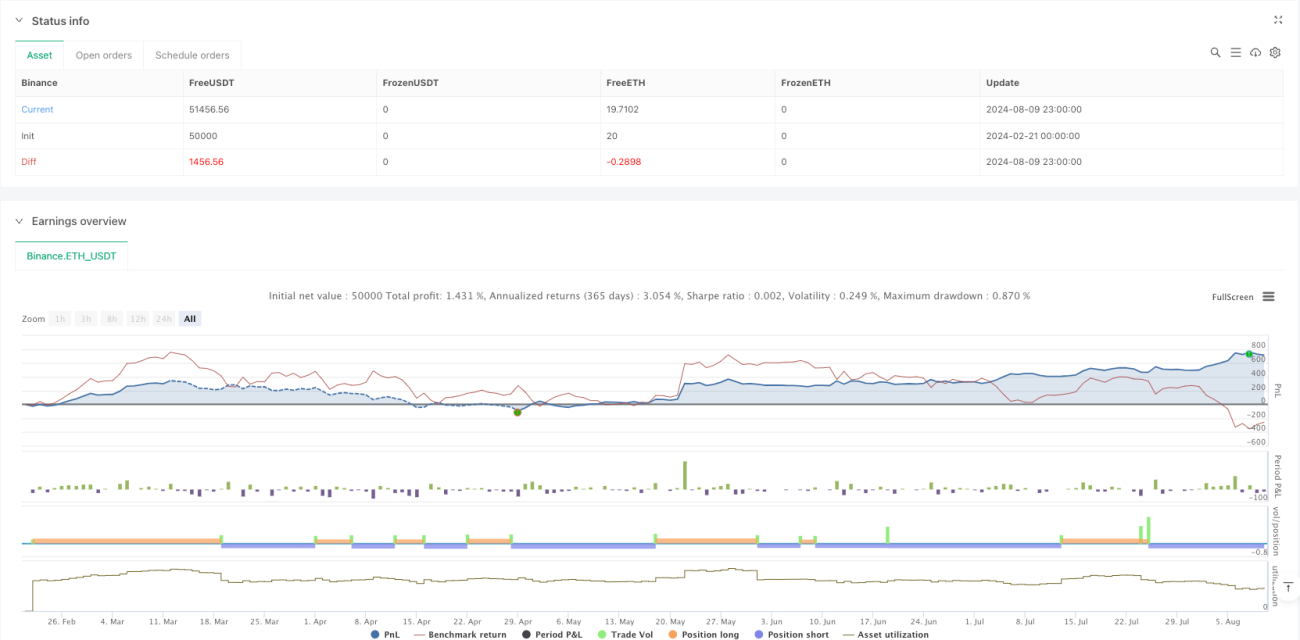
이 전략은 여러 가지 기술 지표를 통합하여 전체적인 트렌드 추적 거래 시스템을 구축한다. 전략의 장점은 여러 신호 확인이 거래의 신뢰성을 높이고, 위험 제어 메커니즘은 전략에 대한 좋은 보호를 제공한다는 것이다. 일부 고유한 위험이 있음에도 불구하고, 제안된 최적화 방향으로 전략의 성능을 더욱 향상시킬 수 있다.
/*backtest
start: 2024-02-21 00:00:00
end: 2024-08-10 00:00:00
period: 1h
basePeriod: 1h
exchanges: [{"eid":"Binance","currency":"ETH_USDT"}]
*/
//@version=6
strategy("Trend-Following Momentum Strategy", overlay=true, default_qty_type=strategy.percent_of_equity, default_qty_value=2)
// PARAMETERS
lengthMA200 = input(200, title="200-day MA Length")
lengthEMA50 = input(50, title="50-day EMA Length")
rsiLength = input(14, title="RSI Length")
macdFastLength = input(12, title="MACD Fast Length")
macdSlowLength = input(26, title="MACD Slow Length")
macdSignalLength = input(9, title="MACD Signal Length")
riskRewardRatio = input(1.5, title="Risk-Reward Ratio")
useTrailingStop = input(true, title="Use Trailing Stop?")
trailingPercent = input(1.0, title="Trailing Stop (%)") / 100
// INDICATORS
ma200 = ta.sma(close, lengthMA200) // 200-day MA
ema50 = ta.ema(close, lengthEMA50) // 50-day EMA
rsi = ta.rsi(close, rsiLength) // RSI
[macdLine, signalLine, _] = ta.macd(close, macdFastLength, macdSlowLength, macdSignalLength)
// TREND CONDITIONS
bullishTrend = close > ma200
bearishTrend = close < ma200
// PULLBACK CONDITION
recentPullbackLong = ta.barssince(close < ema50) < 5 // Price touched EMA50 in last 5 bars
recentPullbackShort = ta.barssince(close > ema50) < 5 // Price touched EMA50 in last 5 bars
// ENTRY CONDITIONS
longEntry = bullishTrend and ta.crossover(macdLine, signalLine) and rsi > 50 and recentPullbackLong
shortEntry = bearishTrend and ta.crossunder(macdLine, signalLine) and rsi < 50 and recentPullbackShort
// EXECUTE TRADES
if longEntry
strategy.entry("Long", strategy.long)
strategy.exit("Long Exit", from_entry="Long", limit=close * (1 + riskRewardRatio), stop=close * (1 - (1 / (1 + riskRewardRatio))), trail_price=useTrailingStop ? close * (1 - trailingPercent) : na)
if shortEntry
strategy.entry("Short", strategy.short)
strategy.exit("Short Exit", from_entry="Short", limit=close * (1 - riskRewardRatio), stop=close * (1 + (1 / (1 + riskRewardRatio))), trail_price=useTrailingStop ? close * (1 + trailingPercent) : na)
// PLOT INDICATORS
plot(ma200, title="200-day MA", color=color.blue, linewidth=2)
plot(ema50, title="50-day EMA", color=color.orange, linewidth=2)