
2
Follow
478
Followers
개요
이 전략은 트렌드 추적과 간격 거래를 결합한 자기 적응 거래 시스템이다. 시스템은 ADX 지표를 통해 시장 상태를 동적으로 식별하고, 트렌드 시장과 충격 시장에서 각각 다른 거래 전략을 사용합니다. 트렌드 시장에서, 전략은 RSI와 MACD 확인과 결합한 이동 평균 크로스 신호를 사용합니다. 충격 시장에서, 전략은 RSI 과잉 구매 과잉 판매 신호와 결합한 브린 밴드 돌파를 사용하여 거래 시스템을 사용합니다. 또한 ATR 기반의 동적 손실 차단 장치를 통합하여 위험을 효과적으로 제어합니다.
전략 원칙
전략의 핵심은 시장 상태를 식별하는 메커니즘이다. ADX가 25 이상일 때 트렌드 시장으로 판단될 때 트렌드 추적 전략을 활성화한다:
- 다면 조건: 50일 평균선 위에 200일 평균선을 뚫고, 동시에 RSI가 50보다 크고 MACD 선이 신호선 위에 있다
- 공백 조건: 50일 평균선 아래 200일 평균선을 통과하고 RSI가 50보다 작고 MACD 라인이 신호선 아래
ADX가 25보다 작을 때 주파수 시장으로 판단하면, 간격 거래 전략을 사용한다:
- 다단계 조건: 가격이 브린을 통과하고 RSI가 40보다 작습니다.
- 공백 조건: 가격 아래에서 브린을 통과하고 RSI가 60보다 크다
손해제어 설정은 ATR의 동적배수 방식을 채택하고, 손해제어는 1.5배 ATR, 손해제어는 3배 ATR <unk>.
전략적 이점
- 시장 적응성: 시장 상황에 따라 거래 전략을 자동으로 전환할 수 있다.
- 다중 신호 확인: 여러 기술 지표의 조합을 통해 거짓 신호를 감소
- 리스크 관리가 개선: 동적 상쇄장치를 적용하여 시장의 변동에 적응
- 명확한 전략 논리: 트렌드 및 간격 판단 기준이 명확하여 최적화된 조정이 가능합니다.
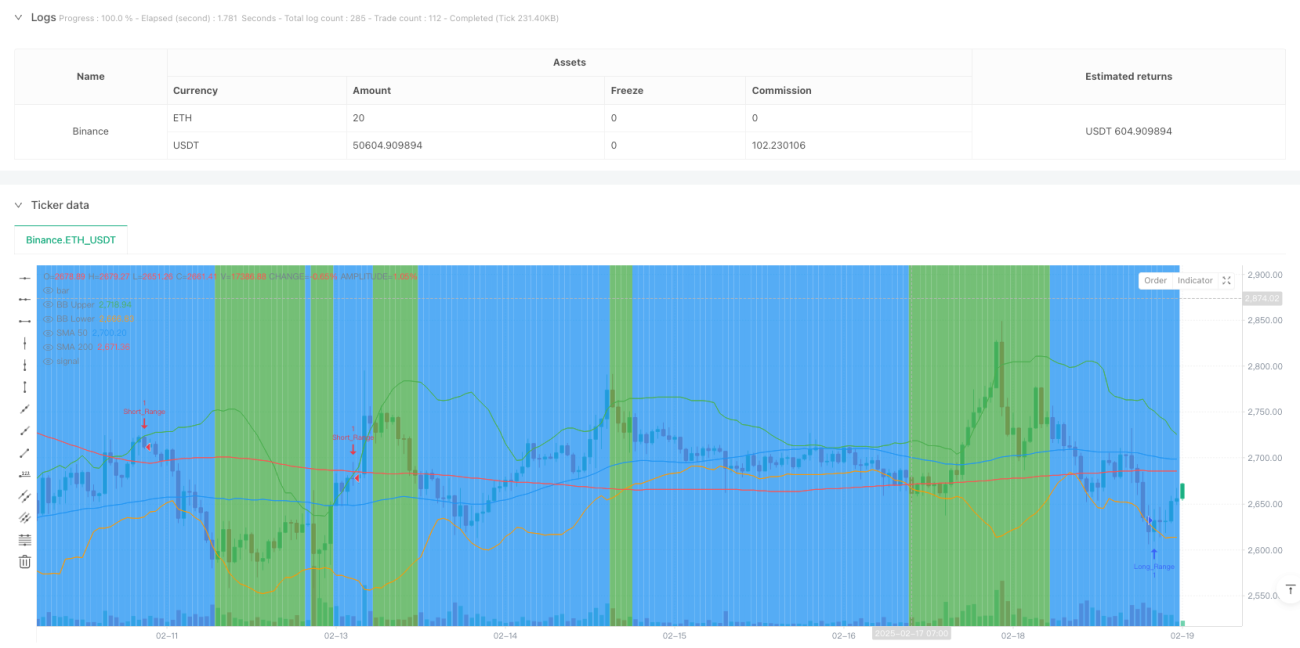
- 시각화 효과: 배경 색으로 시장 상태를 구분하는 것이 직관적입니다.
전략적 위험
- 신호 지연성: 이동 평균과 같은 지표는 지연성을 가지고 있으며, 최적의 진입 지점을 놓칠 수 있습니다.
- 가짜 브레이크 위험: 부린은 위기 시장에서 가짜 브레이크 신호를 올릴 수 있습니다.
- 매개 변수 감수성: ADX <unk>값, ATR 배수 등 매개 변수 설정이 정책 성능에 영향을 미칩니다.
- 시장 전환 위험: 추세와 변동의 전환기에 잘못된 신호를 줄 수 있다
- 정지 범위 위험: 고정 배수의 ATR 정지는 높은 변동 기간에 너무 커질 수 있습니다.
전략 최적화 방향
- 트래픽 분석을 도입: 신호 확인에 트래픽 요소를 추가하여 신호 신뢰성을 높인다.
- 시장 상태 판단을 최적화: ADX를 동적 하락으로 변경하거나 다른 지표와 결합하는 것을 고려할 수 있습니다.
- 손해 차단 메커니즘의 개량: 추적 손해를 도입하거나 변동률에 따라 ATR 배수를 동적으로 조정
- 시간 필터를 추가: 거래 시간 제한을 추가하여 낮은 유동성 기간을 피하십시오.
- 개선된 신호 확인 메커니즘: 가격 형태 분석을 추가하여 신호 품질을 향상시킬 수 있습니다.
요약하다
이 전략은 시장 상태의 동적 인식과 그에 따른 전략 전환을 통해 다양한 시장 환경에 적응합니다. 다중 기술 지표의 조합과 동적 위험 제어 메커니즘을 통해 전략은 더 나은 실용성을 가지고 있습니다. 그러나 여전히 신호 지연 및 가짜 돌파 등의 위험에 주의를 기울여야하며 실제에서 충분한 테스트와 매개 변수 최적화를 권장합니다.
Source
Pine
Related strategies
Comment
All comments (0)
No data
- 1