
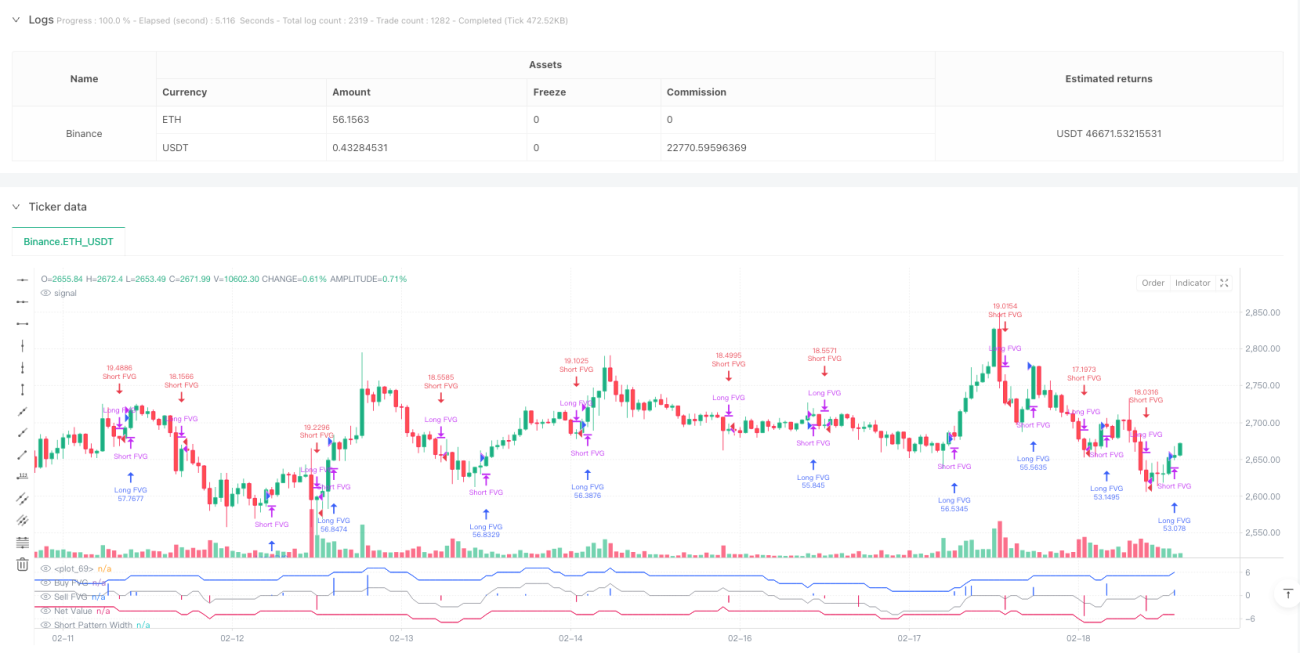
이 전략은 공정 가치 격차 (FVG) 를 기반으로 한 혁신적인 거래 시스템으로, 시장의 가격 격차와 거래량 비정상성을 식별하여 잠재적인 거래 기회를 포착합니다. 이 전략은 동적 계산 메커니즘과 통일 처리 방식을 결합하여 구매 신호를 정확하게 식별 할 수있을뿐만 아니라 거래자가 시장 구조를 더 잘 이해할 수 있도록 시각적으로 표시 할 수 있습니다.
전략의 핵심은 연속적인 K 라인 사이의 가격 격차를 모니터링하여 잠재적인 거래 기회를 식별하는 것입니다. 구체적으로:
이것은 가격 구조에 기반한 혁신적인 거래 전략이며, 공정 가치의 허점을 지능적으로 식별하고 검증하여 시장 기회를 포착합니다. 전략의 설계 개념은 명확하고, 실행 방식은 전문적이며, 확장성이 좋습니다. 제안된 최적화 방향으로 전략의 안정성과 수익성은 더욱 향상될 것으로 예상됩니다.
/*backtest
start: 2024-02-22 00:00:00
end: 2025-02-19 08:00:00
period: 1h
basePeriod: 1h
exchanges: [{"eid":"Binance","currency":"ETH_USDT"}]
*/
// ----------------------------------------------------------------------------
// This Pine Script™ code is subject to the terms of the Mozilla Public License
// 2.0 at https://mozilla.org/MPL/2.0/
// © OmegaTools
// ----------------------------------------------------------------------------
//@version=5
strategy("FVG Oscillator Strategy",
shorttitle="FVG Osc v5 [Strategy]",
overlay=false,
initial_capital=100000,
default_qty_type=strategy.percent_of_equity,
default_qty_value=100)
//------------------------------------------------------------------------------
// 1) Input Parameters
//------------------------------------------------------------------------------
lnt = input.int(50, "Bars Back")
area = input.bool(true, "Show Areas")
upcol = input.color(#2962ff, "Positive Color")
dncol = input.color(#e91e63, "Negative Color")
//------------------------------------------------------------------------------
// 2) FVG Detection
// bfvg = bullish FVG, sfvg = bearish FVG
//------------------------------------------------------------------------------
bfvg = low > high[2]
sfvg = high < low[2]
//------------------------------------------------------------------------------
// 3) Additional Conditions - FVG Verification (Volume, Gap Size)
//------------------------------------------------------------------------------
vol = volume > ta.sma(volume, 10)
batr = (low - high[2]) > ta.sma(low - high[2], lnt) * 1.5
satr = (high - low[2]) > ta.sma(high - low[2], lnt) * 1.5
//------------------------------------------------------------------------------
// 4) Sum of Bullish / Bearish FVG within the Last lnt Bars
//------------------------------------------------------------------------------
countup = math.sum(bfvg ? 1 : 0, lnt) // +1 for each BFVG
countdown = math.sum(sfvg ? -1 : 0, lnt) // -1 for each SFVG
//------------------------------------------------------------------------------
// 5) Verification (e.g., Require Higher Volume or Large Gap)
//------------------------------------------------------------------------------
verifyb = (bfvg and vol[1]) or (bfvg and batr)
verifys = (sfvg and vol[1]) or (sfvg and satr)
//------------------------------------------------------------------------------
// 6) Normalized Gap Values
//------------------------------------------------------------------------------
normb = ((low - high[2]) * countup * 0.75) / ta.highest(low - high[2], lnt)
norms = ((high - low[2]) * countdown * 0.75) / ta.lowest(high - low[2], lnt)
//------------------------------------------------------------------------------
// 7) Total Net FVG Count + Calculation of Maximum for fill()
//------------------------------------------------------------------------------
totcount = countup + countdown
max = math.max(
ta.highest(countup, 200),
ta.highest(math.abs(countdown), 200)
)
//------------------------------------------------------------------------------
// 8) Plotting Values (as in an indicator – can be kept for visualization)
//------------------------------------------------------------------------------
up = plot(countup, "Buy FVG", color=upcol, display=display.none)
down = plot(countdown, "Sell FVG", color=dncol, display=display.none)
zero = plot(0, "", color.new(color.gray, 100), display=display.none, editable=false)
// Net Value (sum of FVG)
plot(totcount, "Net Value", color=color.new(color.gray, 50))
// Filling areas above/below zero
plot(verifyb ? normb : na, "Long Pattern Width", color=upcol, linewidth=1, style=plot.style_histogram)
plot(verifys ? norms : na, "Short Pattern Width", color=dncol, linewidth=1, style=plot.style_histogram)
//------------------------------------------------------------------------------
// 9) Simple Trading Logic (STRATEGY)
//------------------------------------------------------------------------------
// - If "verifyb" is detected, go long.
// - If "verifys" is detected, go short.
//
// You can extend this with Stop Loss, Take Profit,
// closing old positions, etc.
//------------------------------------------------------------------------------
bool goLong = verifyb
bool goShort = verifys
// Basic example: Open Long if verifyb, Open Short if verifys.
if goLong
// First close any short position if it exists
if strategy.position_size < 0
strategy.close("Short FVG")
// Then open Long
strategy.entry("Long FVG", strategy.long)
if goShort
// First close any long position if it exists
if strategy.position_size > 0
strategy.close("Long FVG")
// Then open Short
strategy.entry("Short FVG", strategy.short)