
2
Follow
478
Followers
개요
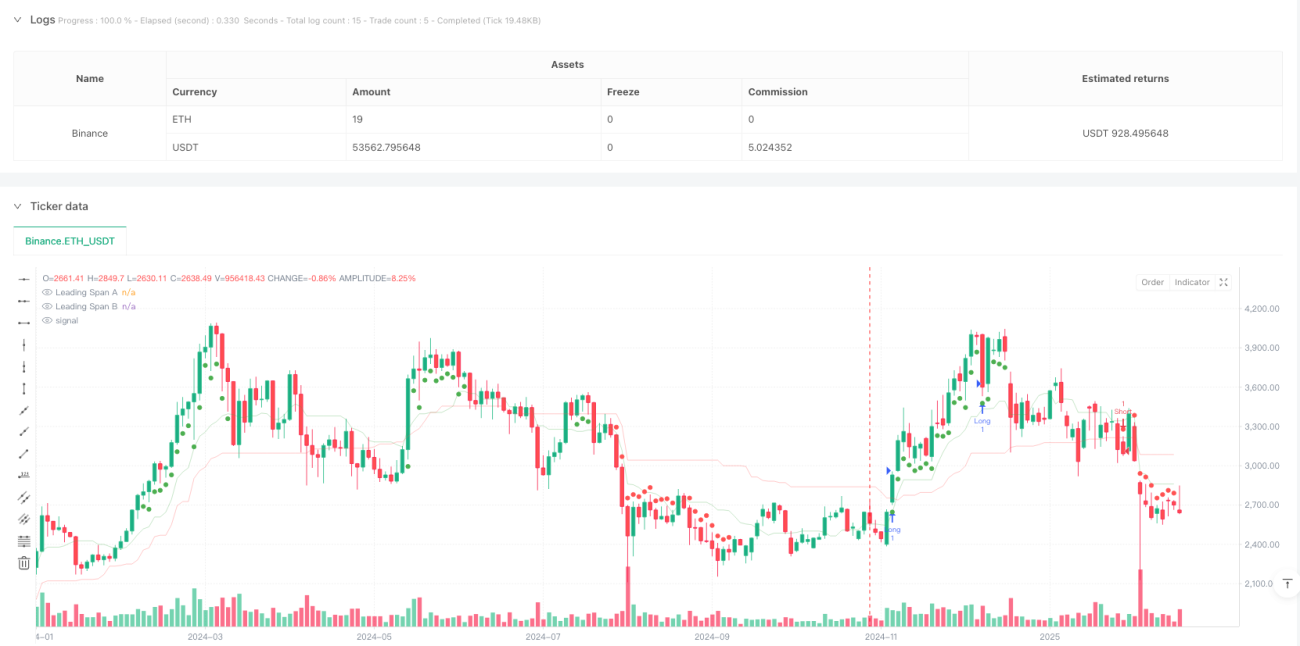
이 전략은 시장 추세, 동력, 변동률의 3차원 분석을 결합한 다중 지표 융합 트렌드 추적 거래 시스템이다. 핵심 논리는 하나의 구름 지표 (이치모쿠 클라우드) 를 통해 시장 추세를 판단하고, MACD 직선 도표 (MACD 직선 도표) 는 동력을 확인하고, 브린 밴드 폭 (Bollinger Band Width) 은 시장 변동 상태를 필터링하며, 주 일선 수준의 트렌드 확인 메커니즘을 도입하고, 마지막으로 ATR 기반의 동적 손실을 통해 위험을 관리한다.
전략 원칙
전략은 여러 층의 신호 필터링 메커니즘을 사용합니다. 첫째, 시장의 큰 흐름을 결정하기 위해 구름 지표의 선도 간격 A와 B를 사용하여 가격이 구름 위에 있거나 아래에 있는지 판단합니다. 둘째, MACD 직선 도표를 사용하여 운동량의 강도를 판단합니다. 상반기 직선 도표가 -0.05보다 크고, 상반기 공백은 0보다 작습니다. 세 번째는 더 큰 수준의 추세 방향을 확인하기 위해 주파수 시간 주기 50 주기 평균선을 도입합니다. 넷째, 브린 대역폭 지표 필터링 낮은 변동률 행태를 사용하여 0.02보다 넓은 폭에서만 포지션을 개시합니다.
전략적 이점
- 다차원 신호 필터링: 트렌드, 동력 및 변동률의 3차원 지표 조합을 통해 가짜 신호를 효과적으로 감소시킨다.
- 다중 시간 주기 분석: 회선 트렌드 확인을 도입하여 거래 방향의 정확성을 향상시킵니다.
- 동적 리스크 관리: ATR 및 브린 대역폭에 기반한 적응적 손해 중지 메커니즘이 수익을 보호하고 동향 발전을 위한 공간을 제공합니다.
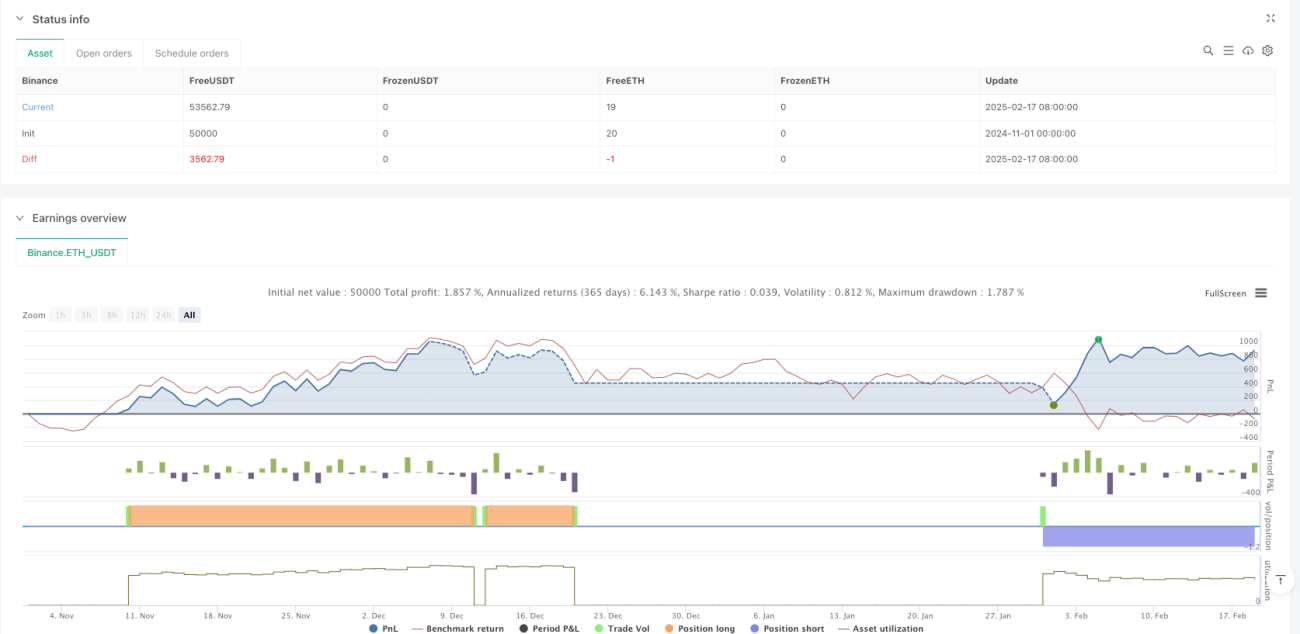
- 회수 효과 우수: 당기순이익 10.80%, 당기손실비율 2.593, 승률 50.70%, 최대 회수율은 1.47%.
전략적 위험
- 동향 의존성: 전략은 흔들리는 시장에서 빈번하게 잘못된 신호를 생성할 수 있다.
- 변수 감수성: 여러 지표 변수들은 다른 시장 조건에 맞게 최적화되어야 한다.
- 지연 위험: 복수의 신호 필터링으로 인해 출입 시기가 뒤떨어지고, 일부 행사가 놓쳐질 수 있다.
- 역추적의 한계: 과거의 성과는 미래의 성과를 나타내지 않으며, 실판은 슬라이드 포인트와 수수료를 고려해야 한다.
전략 최적화 방향
- 신호 시스템 최적화: RSI와 같은 다른 동력 지표를 도입하여 신호 신뢰성을 향상시킬 수 있다.
- 포지션 관리 최적화: 변동률에 따라 포지션 크기를 동적으로 조정할 수 있다.
- 정지 메커니즘 최적화: 이동식 정지 또는 기술 지표에 기반한 정지 조건을 추가할 수 있다.
- 시장 적응성 최적화: 다양한 시장 상태에 대한 동적 조정 매개 변수
요약하다
이 전략은 다차원 지표 융합과 다중 시간 주기 분석을 통해 완전한 트렌드 추적 시스템을 구축하고, 동적 위험 관리 메커니즘을 갖추고 있다. 재측량 성능이 우수하지만, 시장 환경 변화에 따른 위험에 주의를 기울여야 하며, 실물에서 신중하게 검증하고 지속적으로 최적화하는 것이 좋습니다.
Source
Pine
/*backtest
start: 2024-11-01 00:00:00
end: 2025-02-19 08:00:00
period: 2d
basePeriod: 2d
exchanges: [{"eid":"Binance","currency":"ETH_USDT"}]
*/

// This Pine Script™ code is subject to the terms of the Mozilla Public License 2.0 at https://mozilla.org/MPL/2.0/
// © FIWB
//@version=6
strategy("Momentum Edge Strategy - 1D BTC Optimized", overlay=true)Strategy parameters
Related strategies
Comment
All comments (0)
No data
- 1