
2
Follow
478
Followers
개요
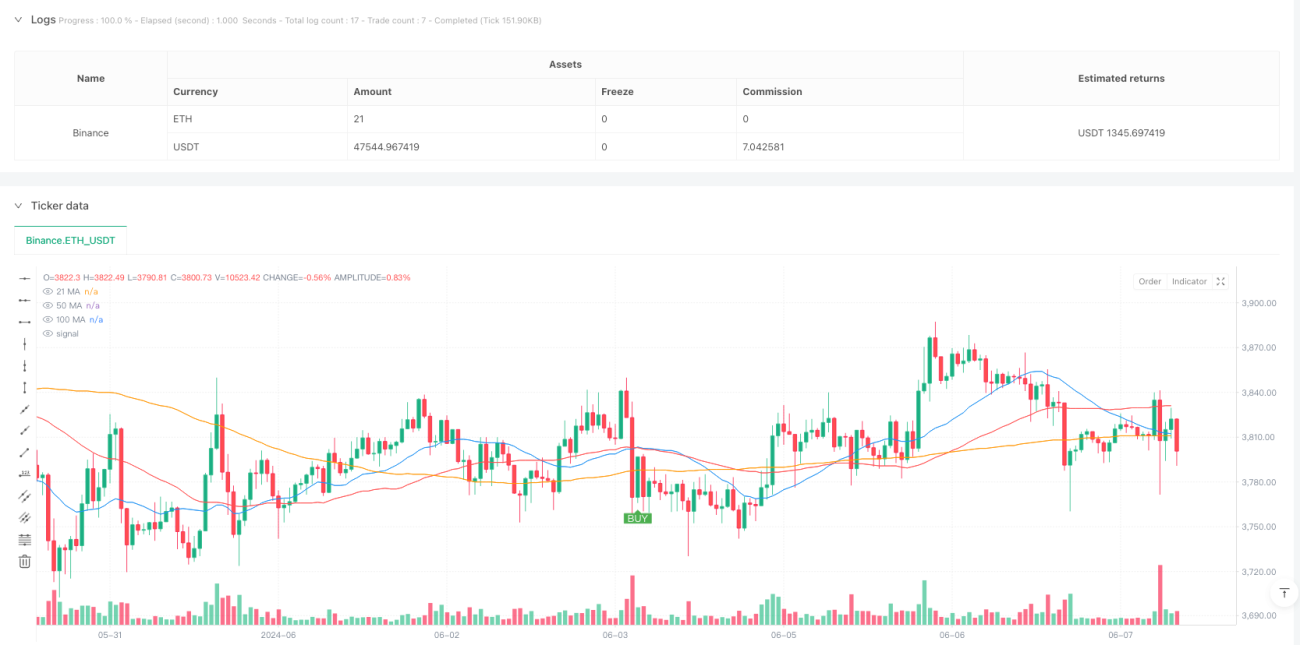
이것은 세 개의 간단한 이동 평균 (SMA) 을 기반으로 한 트렌드 추적 전략입니다. 이 전략은 21, 50, 100 주기의 이동 평균의 교차와 위치 관계를 사용하여 시장의 흐름을 식별하고 적절한 시간에 거래합니다. 이 전략은 주로 5 분 시간 프레임에서 작동하며, 30 분 차트를 참조하여 트렌드 확인을 권장합니다.
전략 원칙
이 전략은 트레이딩 신호를 세 가지 필터링 메커니즘을 사용하여 결정합니다.
- 21주기 평균선을 빠른 평균선으로 사용하여 단기 가격 변화를 포착합니다.
- 50주기 평균선을 중간 평균선으로 사용하여 빠른 평균선과 교차 신호를 형성한다
- 100주기 평균선을 트렌드 필터로 사용하여 거래 방향이 주 트렌드와 일치하는지 확인하십시오.
구매 조건은 동시에 충족되어야 합니다:
- 21은 50의 중간선을 가로질러 올라갑니다.
- 21의 평균선과 50의 평균선은 모두 100의 평균선 위에 있습니다.
판매 조건은 다음과 같습니다:
- 21의 평균선은 아래로 50의 평균선을 통과합니다.
- 21의 평균선과 50의 평균선은 모두 100의 평균선 아래에 있습니다.
전략적 이점
- 복수확인 메커니즘은 가짜 신호를 감소시킵니다.
- 트렌드 필터는 거래 성공률을 높여줍니다.
- 명확한 입출장 규칙
- 여러 시간 프레임에서 사용할 수 있습니다.
- 리스크/수익비율이 1:2로 설정되어 있어 장기적인 수익에 도움이 됩니다.
- 전략 논리는 간단하고 이해하기 쉽고 실행이 가능합니다.
전략적 위험
- 시장의 흔들림으로 인해 거래가 빈번해질 수 있습니다.
- 평균선 지연으로 인해 출전 및 출전 지연이 발생할 수 있습니다.
- 급격한 역전으로 인해 큰 손실이 발생할 수 있습니다.
- 다른 시장 환경으로 인해 변수를 조정해야 합니다.
위험 관리 제안:
- 이 경우, 이 값은 가장 가까운 중요한 하락점 아래로 설정됩니다
- 더 큰 시간 주기 확인 트렌드와 결합
- 수평적인 변동 시장에서 거래하는 것을 피하십시오.
- 정기적으로 평가하고 최적화하는 전략 매개 변수
전략 최적화 방향
- 트렌드 강도를 확인하는 매출 수량 지표
- 역동적인 손해 방지 장치를 추가
- 추세 강도 필터 추가
- 최적화 매개 변수 적응 메커니즘
- 다른 기술 지표와 결합하여 신호 확인
- 시장 변동율 필터를 늘리십시오.
요약하다
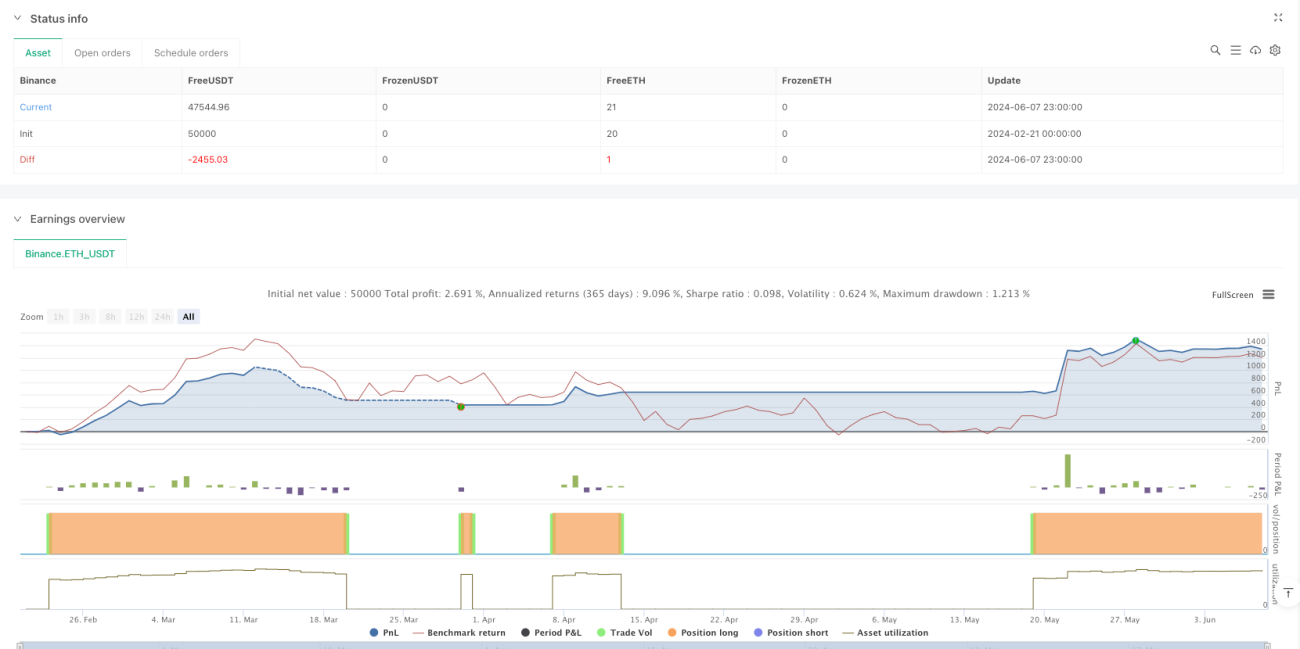
이 전략은 구조적으로 완전하고 논리적으로 명확한 트렌드 추적 전략이다. 트리플 평평선 필터링과 트렌드 확인 메커니즘을 통해 가짜 신호를 효과적으로 줄이고 거래 성공률을 높일 수 있다. 전략은 좋은 확장성을 가지고 있으며, 다양한 시장 환경에 따라 최적의 조정을 할 수 있다. 실물 거래 전에 충분한 재측량과 변수 최적화가 권장된다.
Source
Pine
/*backtest
start: 2024-02-21 00:00:00
end: 2024-06-08 00:00:00
period: 1h
basePeriod: 1h
exchanges: [{"eid":"Binance","currency":"ETH_USDT"}]
*/

// This Pine Script™ code is subject to the terms of the Mozilla Public License 2.0 at https://mozilla.org/MPL/2.0/
// © Vezpa
//@version=5
strategy("Vezpa's Gold Strategy", overlay=true)Strategy parameters
Related strategies
Comment
All comments (0)
No data
- 1