다중 K-라인 패턴을 기반으로 한 트리플 스트라이크 양적 거래 전략

TLS ECS K-LINE MA PATTERN Trend momentum
생성 날짜: 2025-02-21 11:00:33 마지막으로 수정됨: 2025-02-27 17:12:20
복사: 1 클릭수: 382
avatar of ianzeng123 ianzeng123
2
집중하다
319
수행원

다중 K-라인 패턴을 기반으로 한 트리플 스트라이크 양적 거래 전략 다중 K-라인 패턴을 기반으로 한 트리플 스트라이크 양적 거래 전략

개요

이 전략은 트리플 스트라이크 (Three Line Strike) 형태와 앵글핑 패턴 (Engulfing Pattern) 형태를 기반으로 한 양적 거래 전략이다. 이 전략은 연속적인 3개의 K선 형태에 따른 돌파적 반전 K선을 식별함으로써 시장 추세 전환점을 포착하고, 다중 기술 지표와 결합하여 거래 결정을 내린다. 이 전략은 완전한 신호 인식 시스템과 위험 제어 장치를 설계하고, 고도로 사용자 정의 가능한 파라미터 설정을 제공한다.

전략 원칙

전략의 핵심 논리는 두 가지 주요 K선 형태에 기반합니다.

  1. 삼중 타격 형태: 연속적으로 3개의 동방향 K선에 따른 반전 K선을 식별하여 트렌드 반전을 판단한다. 우세한 형태는 연속적으로 3개의 하락하는 빨간 K선에 따른 큰 녹색 K선으로 구성된다.
  2. 흡수 형태: 개별적으로 큰 흡수 K선도 보조 신호로 사용된다. 전략은 현재 K선과 전 K선의 개체 크기를 비교하여 흡수 형태를 식별한다.

전략적 이점

  1. 신호 식별 정확: 전략은 엄격한 수학 계산 방법을 사용하여 K선 형태를 판단하고, 다중 조건 필터링을 통해 신호 품질을 보장한다.
  2. 리스크 제어: 초기 자본, 지분 비율 등의 리스크 파라미터를 설정하고, 반복 입시를 금지한다.
  3. 고도 사용자 정의: 다양한 시장 특성과 거래 요구에 따라 최적화 할 수있는 풍부한 파라미터 설정을 제공합니다.
  4. 시각화 지원: 분석 및 모니터링을 위한 명확한 그래픽 표기 및 힌트를 제공합니다.

전략적 위험

  1. 시장 환경 의존성: 불안정한 시장에서 과도한 가짜 신호가 발생할 수 있다.
  2. 미끄러지점 영향: 대형 침수 K 선의 입구 지점은 더 큰 미끄러지점 영향에 의해 영향을 받을 수 있다.
  3. 지연 위험: 형태 인식은 K 라인을 다수 완료해야 하며, 최적의 입학 시간을 놓칠 수 있다.

전략 최적화 방향

  1. 트래픽 지표 도입: 트래픽 변화를 조합하여 신호 품질을 필터링한다.
  2. 최적화 스톱 손실 설정: ATR 또는 변동률에 따라 스톱 손실 위치를 동적으로 조정하십시오.
  3. 트렌드 필터를 추가: 전체 트렌드를 판단하는 평형 시스템을 추가한다.
  4. 탈퇴 메커니즘을 개선: 더 유연한 수익을 위한 설계

요약하다

이 전략은 체계화된 기술 분석 방법을 통해 시장의 중요한 전환점을 포착하고, 강력한 이론적 기초와 실전적 가치를 가지고 있다. 파라미터 최적화 및 위험 제어의 개선을 통해, 건전한 거래 시스템의 중요한 구성 요소로 사용될 수 있다. 전략의 모듈화 설계는 또한 추가적인 최적화를 위한 좋은 토대를 제공한다.

Overview

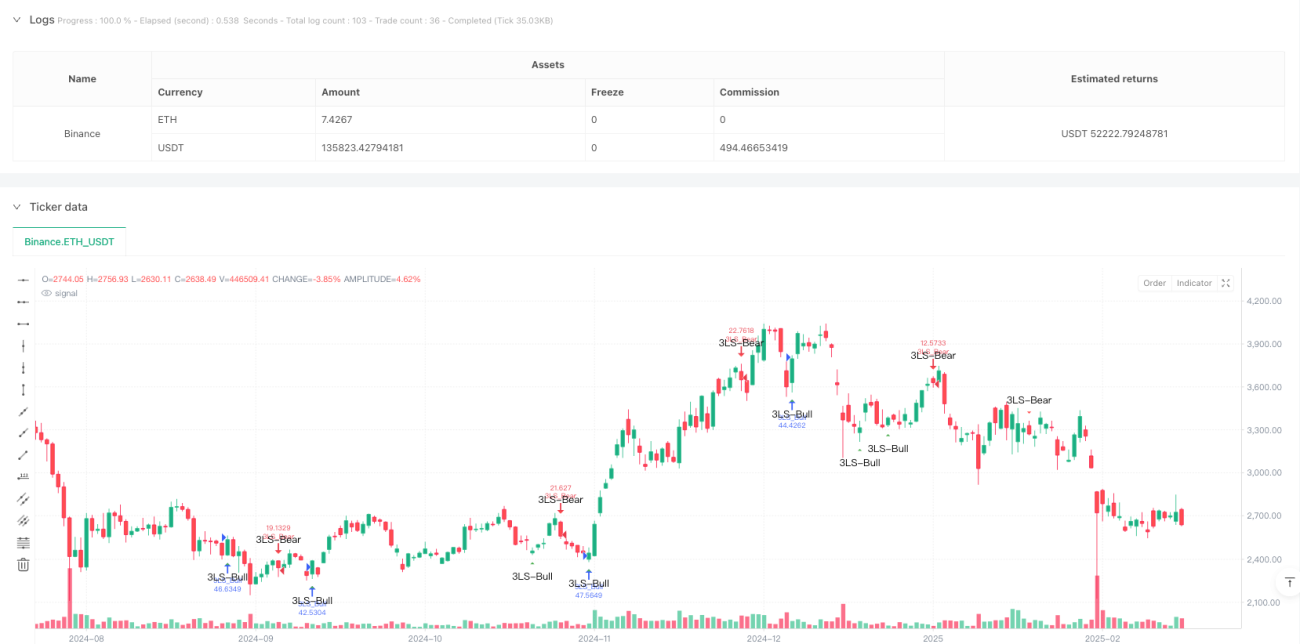
This is a quantitative trading strategy based on Three Line Strike and Engulfing patterns. The strategy captures market turning points by identifying breakthrough reversal candlesticks following three consecutive candles, combining multiple technical indicators for trading decisions. It features a complete signal detection system and risk control mechanism, with highly customizable parameter settings.

Strategy Principle

The core logic is based on two main candlestick patterns:

  1. Three Line Strike Pattern: Identifies trend reversals through three consecutive same-direction candles followed by a reversal candle. Bullish pattern consists of three consecutive red candles followed by a large green engulfing candle; bearish pattern consists of three consecutive green candles followed by a large red engulfing candle.
  2. Engulfing Pattern: Large single engulfing candles serve as auxiliary signals. The strategy identifies engulfing patterns by comparing the body size of current and previous candles.

Strategy Advantages

  1. Precise Signal Identification: Uses strict mathematical calculations to judge candlestick patterns, ensuring signal quality through multiple condition filtering.
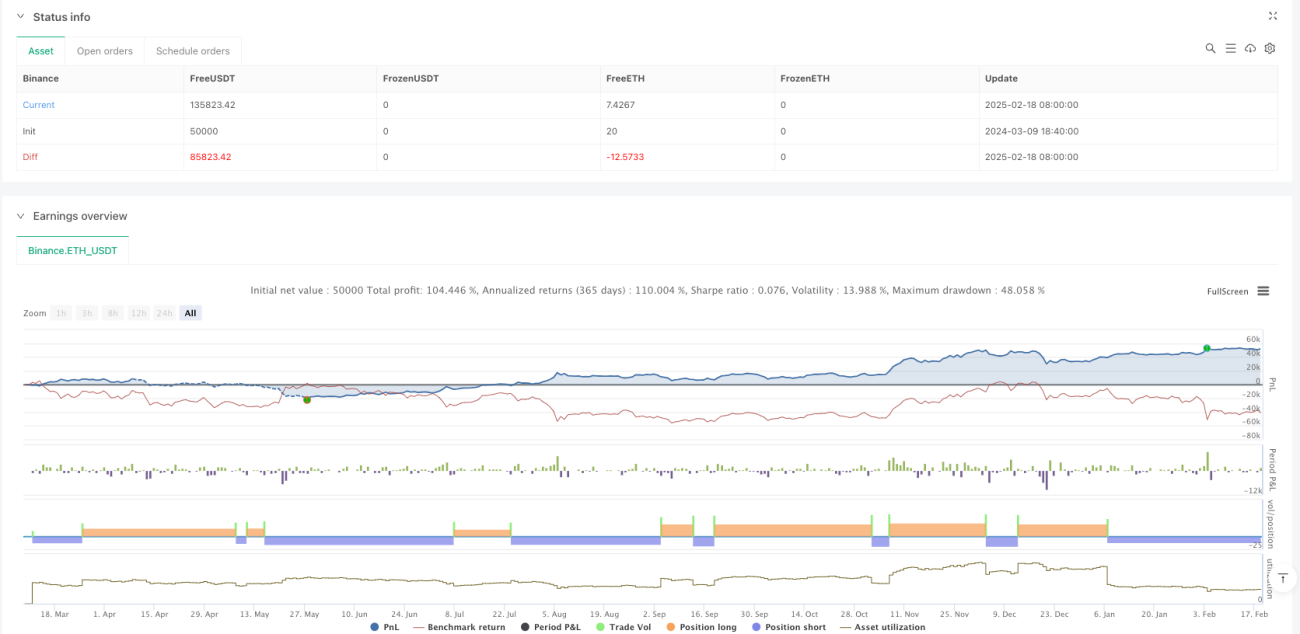
  2. Comprehensive Risk Control: Includes risk parameters like initial capital and position sizing, with pyramiding prevention.
  3. Highly Customizable: Offers rich parameter settings for optimization according to different market characteristics and trading needs.
  4. Visual Support: Provides clear graphical markers and alert messages for analysis and monitoring.

Strategy Risks

  1. Market Environment Dependency: May generate excessive false signals in ranging markets.
  2. Slippage Impact: Entry points for large engulfing candles may be subject to significant slippage.
  3. Delay Risk: Pattern recognition requires multiple candles, potentially missing optimal entry points.

Optimization Directions

  1. Incorporate Volume Indicators: Filter signal quality by combining volume changes.
  2. Optimize Stop Loss Settings: Dynamically adjust stop loss positions based on ATR or volatility.
  3. Add Trend Filtering: Implement moving average systems to judge overall trend.
  4. Improve Exit Mechanism: Design more flexible profit-taking conditions.

Summary

The strategy captures important market turning points through systematic technical analysis, with strong theoretical foundation and practical value. Through parameter optimization and risk control refinement, it can serve as an important component of a robust trading system. The modular design also provides a good foundation for further optimization.

전략 소스 코드
/*backtest
start: 2024-03-09 18:40:00
end: 2025-02-19 08:00:00
period: 1d
basePeriod: 1d
exchanges: [{"eid":"Binance","currency":"ETH_USDT"}]
*/

// Copyright ...
// Based on the TMA Overlay by Arty, converted to a simple strategy example.
// Pine Script v5

//@version=5
strategy(title='3 Line Strike [TTF] - Strategy',
     shorttitle='3LS Strategy [TTF]',
     overlay=true,
     initial_capital=100000,
     default_qty_type=strategy.percent_of_equity,
     default_qty_value=100,
     pyramiding=0)

// -----------------------------------------------------------------------------
//                               INPUTS
// -----------------------------------------------------------------------------

//
// ### 3 Line Strike
//
showBear3LS = input.bool(title='Show Bearish 3 Line Strike', defval=true, group='3 Line Strike',
     tooltip="Bearish 3 Line Strike (3LS-Bear) = 3 green candles followed by a large red candle (engulfing).")
showBull3LS = input.bool(title='Show Bullish 3 Line Strike', defval=true, group='3 Line Strike',
     tooltip="Bullish 3 Line Strike (3LS-Bull) = 3 red candles followed by a large green candle (engulfing).")
showMemeChars = input.bool(title="Plot 3 Line Strike meme symbols", defval=false, group="3 Line Strike")

//
//### Engulfing Candles
//
showBearEngulfing= input.bool(title='Show Bearish Big Candles', defval=false, group='Big Candles')
showBullEngulfing= input.bool(title='Show Bullish Big Candles', defval=false, group='Big Candles')

//
//### Alerts
//
void = input.bool(title="(Info) Alerts are based on detected signals.", defval=true)

// -----------------------------------------------------------------------------
//                          HELPER FUNCTIONS
// -----------------------------------------------------------------------------

// Function: Get the 'color' of the candle: -1 = red, 0 = doji, +1 = green
getCandleColorIndex(barIndex) =>
    int ret = na
    if (close[barIndex] > open[barIndex])
        ret := 1
    else if (close[barIndex] < open[barIndex])
        ret := -1
    else
        ret := 0
    ret

// Function: Check if the candle is engulfing (based on the body size of the candles)
isEngulfing(checkBearish) =>
    // Size of the previous candle
    sizePrevCandle = close[1] - open[1]
    // Size of the current candle
    sizeCurrentCandle = close - open
    isCurrentLargerThanPrevious = math.abs(sizeCurrentCandle) > math.abs(sizePrevCandle)
    
    // Bearish / Bullish division
    if checkBearish
        // Bearish engulfing: previous green, current larger red
        isGreenToRed = (getCandleColorIndex(0) < 0) and (getCandleColorIndex(1) > 0)
        isCurrentLargerThanPrevious and isGreenToRed
    else
        // Bullish engulfing: previous red, current larger green
        isRedToGreen = (getCandleColorIndex(0) > 0) and (getCandleColorIndex(1) < 0)
        isCurrentLargerThanPrevious and isRedToGreen

// Simplified calls for bullish/bearish engulfing
isBearishEngulfing() => isEngulfing(true)
isBullishEngulfing() => isEngulfing(false)

// Function: 3 consecutive candles of one color followed by the opposite engulfing candle
// 3 Line Strike - Bearish
is3LSBear() =>
    // Three consecutive green candles?
    is3LineSetup = (getCandleColorIndex(1) > 0) and (getCandleColorIndex(2) > 0) and (getCandleColorIndex(3) > 0)
    // Followed by Bearish engulfing
    is3LineSetup and isBearishEngulfing()

// 3 Line Strike - Bullish
is3LSBull() =>
    // Three consecutive red candles?
    is3LineSetup = (getCandleColorIndex(1) < 0) and (getCandleColorIndex(2) < 0) and (getCandleColorIndex(3) < 0)
    // Followed by Bullish engulfing
    is3LineSetup and isBullishEngulfing()

// -----------------------------------------------------------------------------
//                             SIGNALS
// -----------------------------------------------------------------------------

// ### 3 Line Strike
is3LSBearSig = is3LSBear()
is3LSBullSig = is3LSBull()

// Meme icons vs. standard shapes
plotchar(showBull3LS and showMemeChars ? is3LSBullSig : na, char="🍆", color=color.rgb(0, 255, 0, 0),
         location=location.belowbar, size=size.tiny, text='3LS-Bull', title='3 Line Strike Up (Meme Icon)', editable=false)
plotchar(showBear3LS and showMemeChars ? is3LSBearSig : na, char="🍑", color=color.rgb(255, 0, 0, 0),
         location=location.abovebar, size=size.tiny, text='3LS-Bear', title='3 Line Strike Down (Meme Icon)', editable=false)

plotshape(showBull3LS and not showMemeChars ? is3LSBullSig : na, style=shape.triangleup,
         color=color.green, location=location.belowbar, size=size.small, text='3LS-Bull', title='3 Line Strike Up')
plotshape(showBear3LS and not showMemeChars ? is3LSBearSig : na, style=shape.triangledown,
         color=color.red, location=location.abovebar, size=size.small, text='3LS-Bear', title='3 Line Strike Down')

// ### Engulfing Candles
isBullEngulfingSig = isBullishEngulfing()
isBearEngulfingSig = isBearishEngulfing()

plotshape(showBullEngulfing ? isBullEngulfingSig : na, style=shape.triangleup,
         location=location.belowbar, color=color.new(color.green,0), size=size.tiny, title='Big Candle Up')
plotshape(showBearEngulfing ? isBearEngulfingSig : na, style=shape.triangledown,
         location=location.abovebar, color=color.new(color.red,0), size=size.tiny, title='Big Candle Down')

// -----------------------------------------------------------------------------
//                               ALERTS
// -----------------------------------------------------------------------------

// 3LS - "Old" alertcondition + "New" alert() (based on what people use)
alertcondition(showBull3LS and is3LSBullSig, title='Bullish 3 Line Strike',
     message='{{exchange}}:{{ticker}} {{interval}} - Bullish 3 Line Strike')
alertcondition(showBear3LS and is3LSBearSig, title='Bearish 3 Line Strike',
     message='{{exchange}}:{{ticker}} {{interval}} - Bearish 3 Line Strike')

if (showBull3LS and is3LSBullSig)
    m = syminfo.tickerid + ' ' + timeframe.period + ' - Bullish 3 Line Strike'
    alert(message=str.tostring(m), freq=alert.freq_once_per_bar_close)

if (showBear3LS and is3LSBearSig)
    m = syminfo.tickerid + ' ' + timeframe.period + ' - Bearish 3 Line Strike'
    alert(message=str.tostring(m), freq=alert.freq_once_per_bar_close)

// Engulfing - "Old" alertcondition + "New" alert()
alertcondition(showBullEngulfing and isBullEngulfingSig, title='Bullish Engulfing',
     message='{{exchange}}:{{ticker}} {{interval}} - Bullish candle engulfing previous candle')
alertcondition(showBearEngulfing and isBearEngulfingSig, title='Bearish Engulfing',
     message='{{exchange}}:{{ticker}} {{interval}} - Bearish candle engulfing previous candle')

if (showBullEngulfing and isBullEngulfingSig)
    m = syminfo.tickerid + ' ' + timeframe.period + ' - Bullish candle engulfing previous candle'
    alert(message=str.tostring(m), freq=alert.freq_once_per_bar_close)

if (showBearEngulfing and isBearEngulfingSig)
    m = syminfo.tickerid + ' ' + timeframe.period + ' - Bearish candle engulfing previous candle'
    alert(message=str.tostring(m), freq=alert.freq_once_per_bar_close)

// -----------------------------------------------------------------------------
//                          STRATEGY ENTRY ORDERS
// -----------------------------------------------------------------------------
//
// Logic for entering trades. If display is enabled and a signal is detected, a trade will be entered.
//
// 3 Line Strike
if (showBull3LS and is3LSBullSig)
    strategy.entry("3LS_Bull", strategy.long, comment="3LS Bullish")

if (showBear3LS and is3LSBearSig)
    strategy.entry("3LS_Bear", strategy.short, comment="3LS Bearish")

// Engulfing
if (showBullEngulfing and isBullEngulfingSig)
    strategy.entry("BullEngulf", strategy.long, comment="Bullish Engulfing")

if (showBearEngulfing and isBearEngulfingSig)
    strategy.entry("BearEngulf", strategy.short, comment="Bearish Engulfing")

//
// End of script