범위 거래와 다중 지표 추세 추적을 결합한 적응형 전략

supertrend EMA ADX RSI BB VWAP DMI SMA ATR HLC3
생성 날짜: 2025-02-21 11:08:52 마지막으로 수정됨: 2025-02-21 11:08:52
복사: 1 클릭수: 372
avatar of ianzeng123 ianzeng123
2
집중하다
319
수행원

범위 거래와 다중 지표 추세 추적을 결합한 적응형 전략 범위 거래와 다중 지표 추세 추적을 결합한 적응형 전략

개요

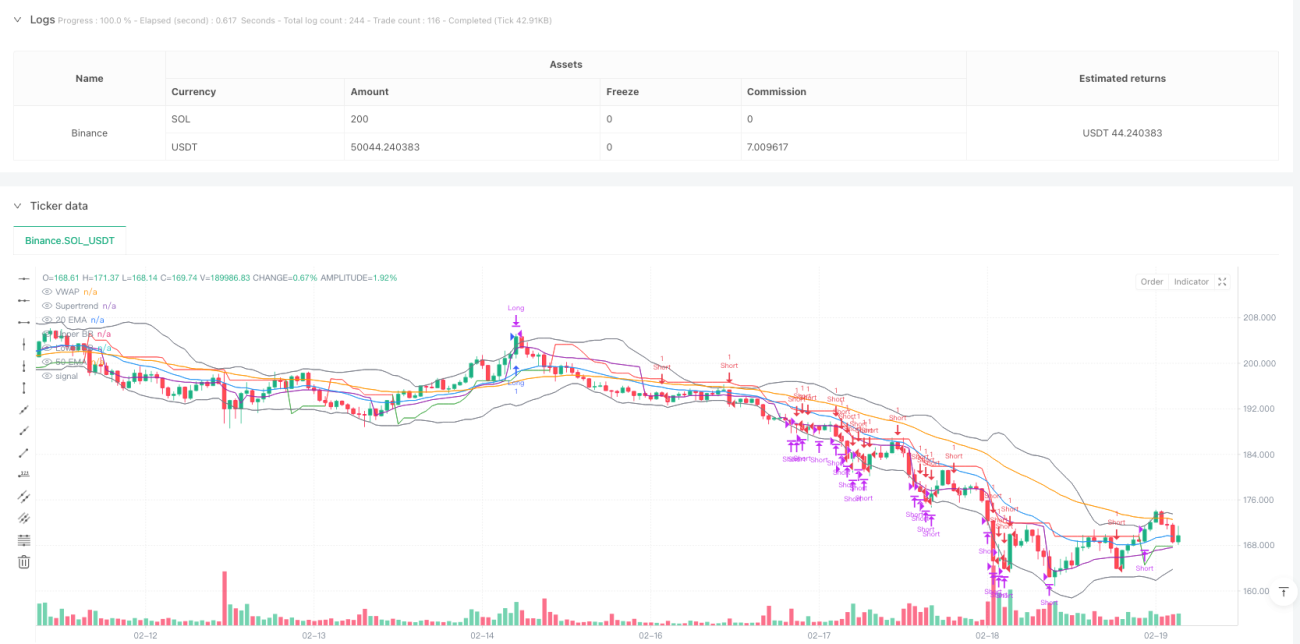
이 전략은 트렌드 추적과 간격 거래를 결합한 자기 적응 거래 시스템이다. 그것은 여러 기술적 지표의 연동 협조를 통해, 다른 시장 환경에서 유연하게 거래 모드를 전환한다. 전략은 Supertrend, 이동 평균선, ADX, RSI 및 브린 벨트와 같은 지표를 사용하여 시장 상태를 식별하고 거래 신호를 결정하며, VWAP와 함께 가격 참조를 수행하고, 위험을 제어하기 위해 손실 제도를 설정한다.

전략 원칙

전략의 핵심 논리는 두 부분으로 나다. 트렌드 추적과 간격 거래. 트렌드 시장에서 (ADX>25에 의해 결정), 전략은 Supertrend 방향, EMA 교차 및 VWAP 위치에 따라 신호를 생성한다.

  • 트렌드 추적 모드: ADX>25이 활성화되면, 2050 주기 EMA의 위치 관계, 슈퍼트렌드 방향과 가격에 대한 VWAP의 위치 통합 판단
  • 간격 거래 모드: ADX <25이 활성화되면, 가격이 브린의 경계와 RSI가 극한에 도달했을 때 입문
  • 출구 조건은 다음과 같습니다: 스톱 손실 트리거, 슈퍼 트렌드 반전 또는 RSI 극치

전략적 이점

  1. 적응력: 시장 상황에 따라 거래 모드를 자동으로 전환할 수 있습니다.
  2. 다중 확인: 여러 지표의 교차 검증을 사용하여 신호의 신뢰성을 향상시킵니다.
  3. 리스크 관리가 완벽합니다: 고정된 상쇄율을 설정하고 RSI 극한값을 사용하여 동적으로 조정합니다.
  4. 융합성: 동향을 파악하고, 변동하는 시장에서 수익을 창출하는 능력
  5. 시각화 지원: 중요한 지표의 그래픽 표시를 제공하여 의사 결정을 분석하는 데 도움이 됩니다.

전략적 위험

  1. 매개 변수 민감성: 여러 지표 매개 변수의 설정이 정책 성능에 영향을 미칩니다.
  2. 시그널 지연: 기술 지표 자체의 지연
  3. 가짜 돌파구 위험: 가로판 시장에서 가짜 신호를 낼 수 있다
  4. 계산 복잡성: 여러 지표의 실시간 계산은 실행 효율성에 영향을 미칠 수 있습니다.
  5. 시장 적응성: 특정 시장 환경에서는 좋지 않을 수 있습니다.

전략 최적화 방향

  1. 동적 변수 조정: 변동률에 따라 각 지표 변수를 자동으로 조정할 수 있습니다.
  2. 트래픽 분석을 도입: 신호의 유효성을 검증하기 위한 트래픽 지표를 추가
  3. 손해 차단 메커니즘을 최적화: ATR 동적 손해 차단을 고려할 수 있습니다.
  4. 시간 필터를 추가: 거래 시간 창을 추가하여 비효율적인 시간을 피합니다.
  5. 시장 감정 지표: 예측 정확성을 높이기 위해 시장 감정 지표를 통합합니다.

요약하다

이것은 합리적으로 설계된, 논리적으로 완성된 종합적 전략이다. 다중 지표의 조화와 모드 스위치를 통해, 서로 다른 시장 환경에서 어느 정도의 적응력을 유지할 수 있다. 약간의 잠재적인 위험이 있음에도 불구하고, 합리적인 위험 제어와 지속적인 최적화를 통해, 이 전략은 실전 응용 가치 있다. 실제 사용 시 충분한 매개 변수 최적화 및 재검증을 권장한다.

전략 소스 코드
/*backtest
start: 2025-01-27 00:00:00
end: 2025-02-20 00:00:00
period: 1h
basePeriod: 1h
exchanges: [{"eid":"Binance","currency":"SOL_USDT"}]
*/

//@version=5
strategy("Nifty/BankNifty Multi-Strategy v2", overlay=true, margin_long=100, margin_short=100)

// ———— Inputs ———— //
// Supertrend
atrPeriod = input.int(10, "ATR Period")
supertrendMultiplier = input.float(2.0, "Supertrend Multiplier", step=0.1)

// EMA
ema20Period = input.int(20, "20 EMA Period")
ema50Period = input.int(50, "50 EMA Period")

// ADX/DMI
adxThreshold = input.int(25, "ADX Trend Threshold")
adxLength = input.int(14, "ADX Length")

// RSI
rsiLength = input.int(14, "RSI Length")
rsiOverbought = input.int(70, "RSI Overbought")
rsiOversold = input.int(30, "RSI Oversold")

// Bollinger Bands
bbLength = input.int(20, "BB Length")
bbStdDev = input.float(2.0, "BB Std Dev", step=0.1)

// Stop-Loss
stopLossPerc = input.float(1.0, "Stop-Loss %", step=0.1)

// ———— Calculations ———— //
// Supertrend
[supertrend, direction] = ta.supertrend(supertrendMultiplier, atrPeriod)

// EMAs
ema20 = ta.ema(close, ema20Period)
ema50 = ta.ema(close, ema50Period)

// ADX via DMI (corrected)
[dip, din, adx] = ta.dmi(adxLength, adxLength) // ta.dmi(diLength, adxSmoothing)

// RSI
rsi = ta.rsi(close, rsiLength)

// Bollinger Bands
basis = ta.sma(close, bbLength)
upperBB = basis + ta.stdev(close, bbLength) * bbStdDev
lowerBB = basis - ta.stdev(close, bbLength) * bbStdDev

// VWAP
vwapValue = ta.vwap(hlc3)

// ———— Strategy Logic ———— //
trendingMarket = adx > adxThreshold

// Trend-Following Strategy
emaBullish = ema20 > ema50
priceAboveVWAP = close > vwapValue

longConditionTrend = trendingMarket and direction < 0 and emaBullish and priceAboveVWAP
shortConditionTrend = trendingMarket and direction > 0 and not emaBullish and close < vwapValue

// Range-Bound Strategy
priceNearLowerBB = close <= lowerBB
priceNearUpperBB = close >= upperBB

longConditionRange = not trendingMarket and priceNearLowerBB and rsi < rsiOversold
shortConditionRange = not trendingMarket and priceNearUpperBB and rsi > rsiOverbought

// ———— Entries/Exits ———— //
if (longConditionTrend or longConditionRange)
    strategy.entry("Long", strategy.long)
    stopPriceLong = strategy.position_avg_price * (1 - stopLossPerc / 100)
    strategy.exit("Exit Long", "Long", stop=stopPriceLong)

if (shortConditionTrend or shortConditionRange)
    strategy.entry("Short", strategy.short)
    stopPriceShort = strategy.position_avg_price * (1 + stopLossPerc / 100)
    strategy.exit("Exit Short", "Short", stop=stopPriceShort)

// Exit on Supertrend flip or RSI extremes
if (direction > 0 or rsi >= rsiOverbought)
    strategy.close("Long")

if (direction < 0 or rsi <= rsiOversold)
    strategy.close("Short")

// ———— Visualization ———— //
plot(supertrend, "Supertrend", color = direction < 0 ? color.green : color.red)
plot(ema20, "20 EMA", color.blue)
plot(ema50, "50 EMA", color.orange)
plot(vwapValue, "VWAP", color.purple)
plot(upperBB, "Upper BB", color.gray)
plot(lowerBB, "Lower BB", color.gray)