EMA 크로스오버 및 RSI 필터링을 기반으로 한 적응형 동적 손절매 및 손절매 전략

2
Follow
478
Followers
개요
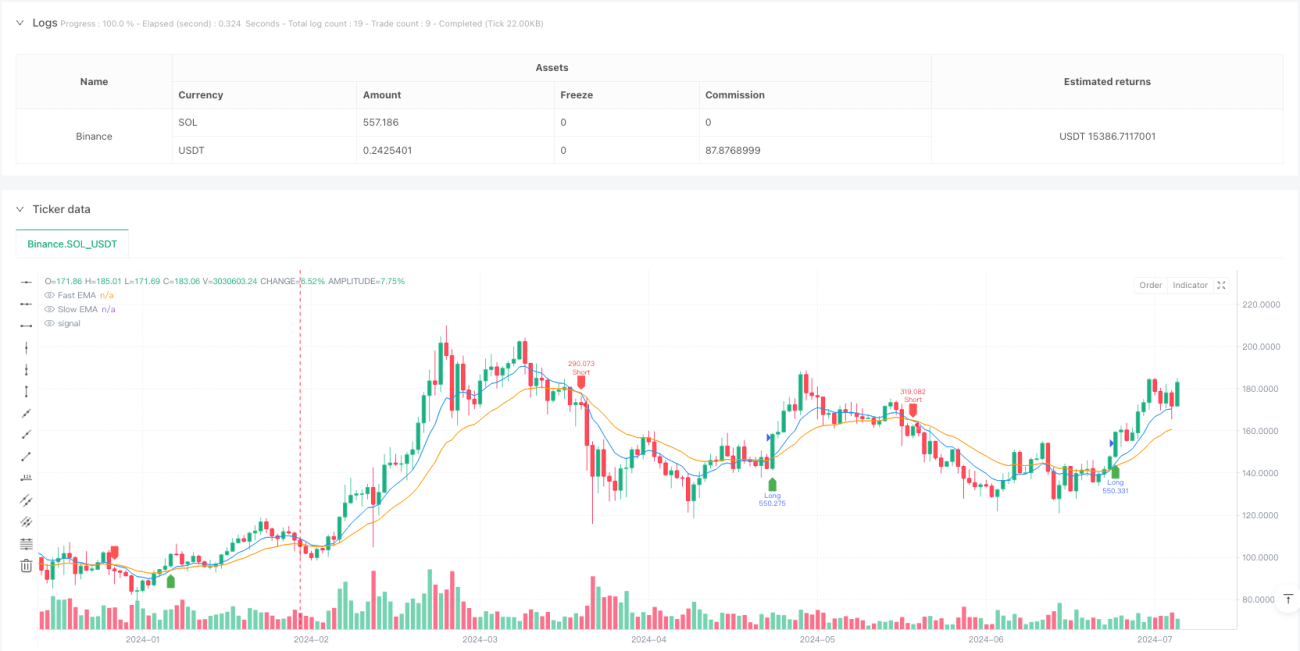
이 전략은 평행선 교차, RSI 필터링 및 ATR 기반의 동적 스톱 손실을 결합한 양적 거래 시스템입니다. 전략은 빠른 및 느린 지수 이동 평균 (EMA) 의 교차로 트렌드 전환점을 확인하고, 상대적으로 강한 지수 (RSI) 를 필터로 도입하여 과도한 구매 또는 판매 영역에서 거래를 피합니다. 특히 실제 파장을 사용하여 ATR 동적 스톱 손실 위치를 조정하여 시장의 변동성에 따라 위험 관리 매개 변수를 조정할 수 있습니다.
전략 원칙
전략의 핵심 논리는 다음과 같은 핵심 구성 요소를 기반으로 합니다.
- 트렌드 판단: 9주기 및 21주기 EMA를 이용하여 트렌드 방향의 변화를 확인한다. 빠른 선에서 느린 선을 통과하는 것은 볼 수 있는 신호로 간주하고, 빠른 선 아래에서 느린 선을 통과하는 것은 볼 수 있는 신호로 간주한다.
- 거래 필터: 14주기 RSI 지표 필터 거래 신호를 사용하여 RSI가 30 (오버셀 영역) 이 높을 때만 과다 주문을 실행하고 70 (오버 바이 영역) 이 낮을 때만 공명 주문을 실행합니다.
- 위험 관리: 14주기 ATR 동적 설정 중지 손실 및 중지 위치, 중지 손실이 2.5배 ATR, 중지 중지 5배 ATR ((2배 중지 거리), 위험 수익 비율이 1:2이다.
전략적 이점
- 동적 적응성: ATR을 통해 자동으로 스톱포드 포지션을 조정하여 전략이 다양한 시장 환경의 변동적 특성에 적응할 수 있도록 한다.
- 다중 확인 메커니즘: 트렌드 및 동력 지표와 결합하여 잘못된 신호의 영향을 줄입니다.
- 리스크 수익 비율 최적화: 1: 2의 리스크 수익 비율 설정을 사용하여 위험을 관리하면서 높은 수익을 추구한다.
- 시각화 지원: 신호 표기 및 평평선 표시를 통해 거래자가 시장 상황을 직관적으로 이해할 수 있습니다.
전략적 위험
- 흔들림 시장의 위험: 수평 변동 시장에서, 빈번한 평행선 교차는 과도한 거래로 이어질 수 있다.
- 슬라이드 포인트 영향: 시장이 급격히 변동할 때, 실제 거래 가격은 신호 가격과 큰 편차가 있을 수 있다.
- 변수 감수성: 전략 효과는 EMA 주기, RSI 마이너스 및 ATR 배수와 같은 변수 설정에 민감하다.
전략 최적화 방향
- 시장 환경 식별: 트렌드 강도 지표 (ADX와 같은) 를 도입하고, 강한 트렌드와 흔들리는 시장에서 다른 파라미터 설정을 사용합니다.
- 포지션 관리 최적화: RSI와 ATR 값에 따라 포지션 크기를 동적으로 조정하고, 신호 강도가 높을 때 포지션을 증가시킨다.
- 출구 메커니즘 개선: 이동 상쇄를 추가하여 추세가 지속될 때 더 많은 수익을 보호하는 것을 고려하십시오.
- 시간 필터: 거래 시간 창 제한을 추가하여 낮은 변동성이있는 시간에 거래하는 것을 피합니다.
요약하다
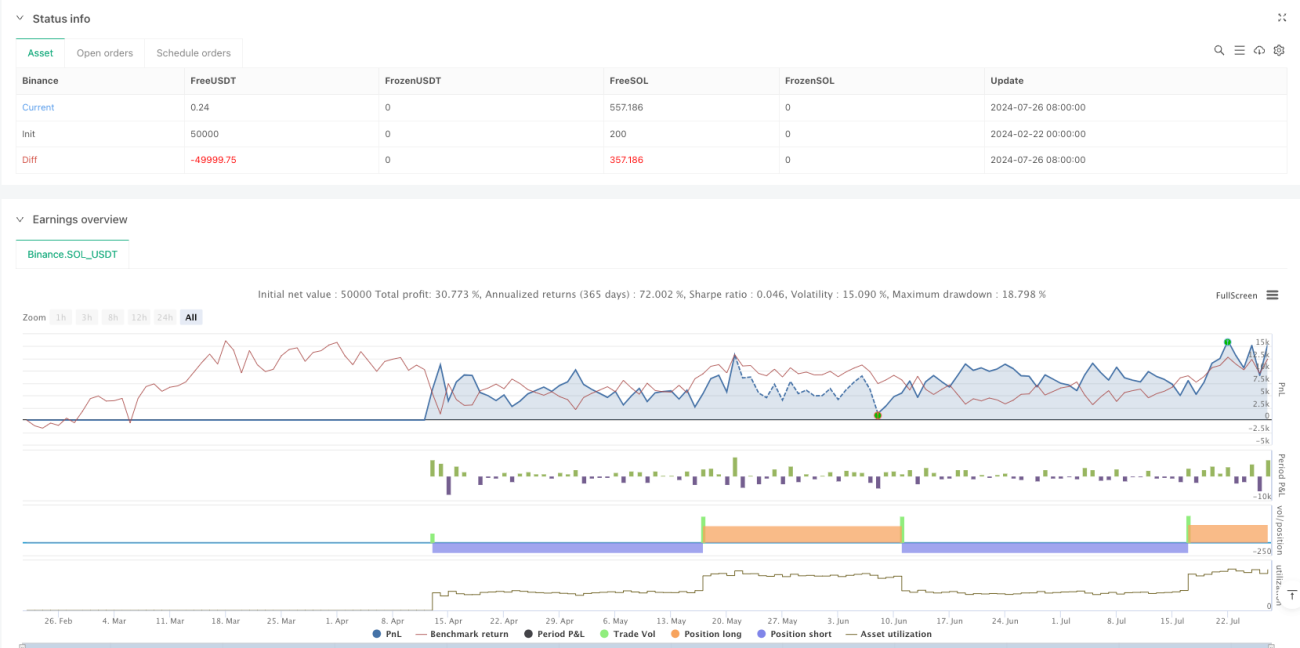
이 전략은 평행 시스템 트렌드 식별, RSI 필터 가짜 신호, ATR 동적 리스크 관리, 완전한 거래 시스템을 구축한다. 전략의 주요 특징은 시장의 변동에 따라 거래 매개 변수를 조정할 수 있는 자율성이 높다. 최적화 방향을 구현함으로써 전략의 안정성과 수익성을 더욱 향상시킬 수 있다. 실전 거래 전에 충분한 역사적 데이터 회귀와 매개 변수 최적화를 권장한다.
Source
Pine
//@version=6
strategy("High Win Rate Dogecoin Strategy", overlay=true, default_qty_type=strategy.percent_of_equity, default_qty_value=100)

// Input Parameters
fastLength = input(9, title="Fast EMA Length")
slowLength = input(21, title="Slow EMA Length")
atrLength = input(14, title="ATR Length")
atrMultiplier = input(2.5, title="ATR Multiplier")
rsiLength = input(14, title="RSI Length")
rsiOverbought = input(70, title="RSI Overbought")
rsiOversold = input(30, title="RSI Oversold")
Strategy parameters
Related strategies
Comment
All comments (0)
No data
- 1