개요
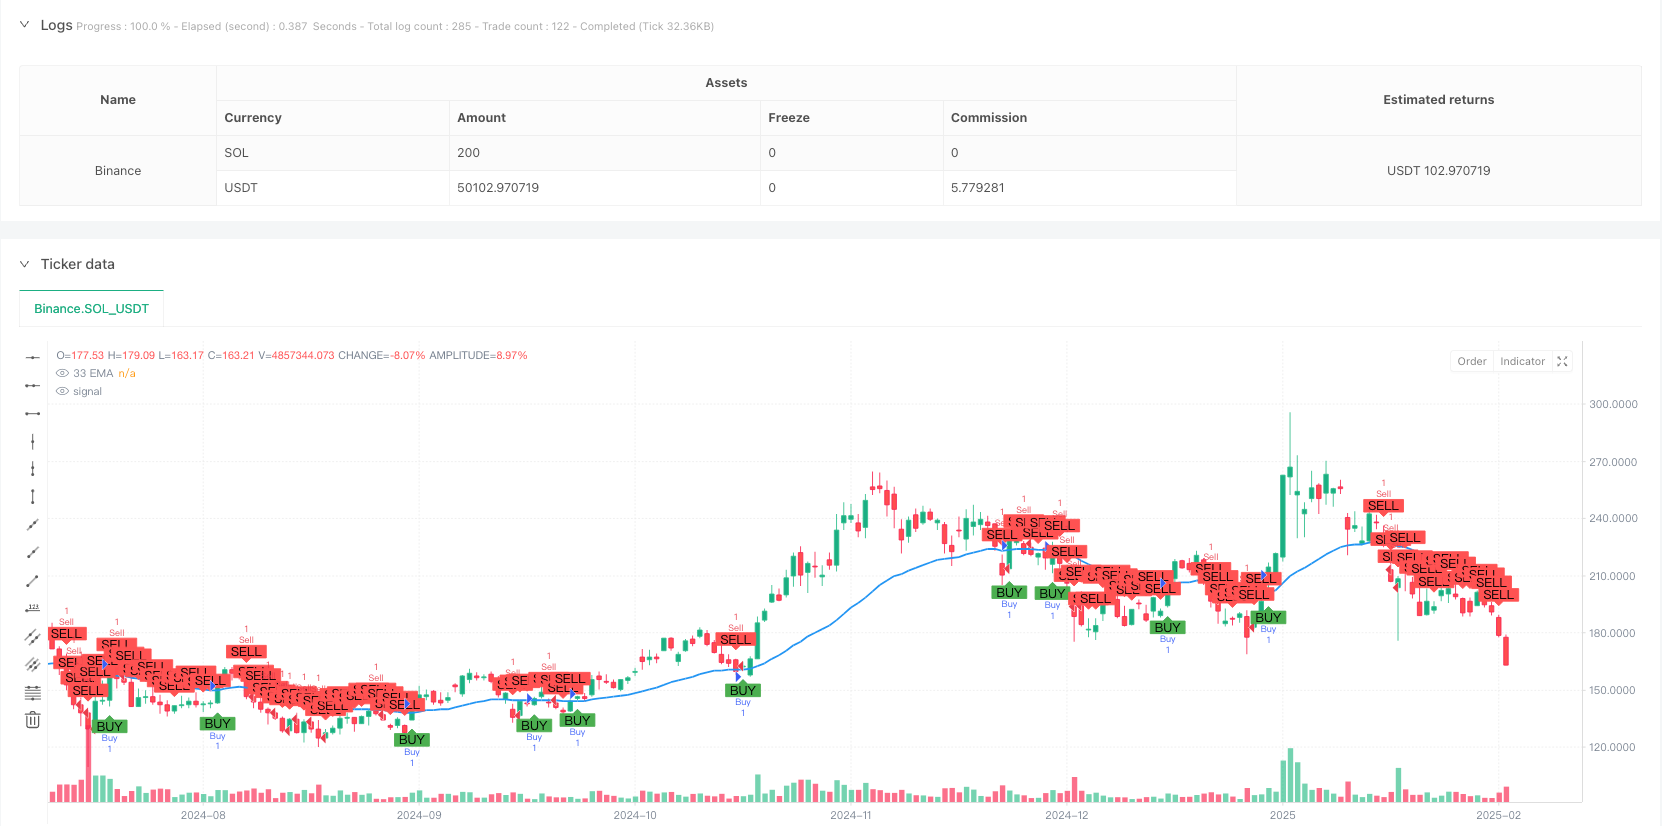
이 전략은 33주기 지수 이동 평균 (EMA) 을 기반으로 한 트렌드 추적 거래 시스템이다. 가격과 EMA의 교차 관계를 통해 시장의 트렌드 변화를 식별하고, 변동의 높고 낮은 점과 결합하여 스톱 손실 위치를 설정하여 트렌드의 동적 추적과 위험을 제어한다.
전략 원칙
전략의 핵심 논리는 가격과 33주기 EMA의 교차 관계를 관찰하여 트렌드 방향을 판단하는 것이다. 종결 가격이 상향으로 돌파되고 EMA를 안정화하면, 다중 신호를 유발한다. 종결 가격이 하향으로 돌파되고 EMA를 무너뜨리면, 다중 신호를 유발한다. 전략은 14주기의 높고 낮은 지점을 파동 참조로 사용하여, 최고 지점을 다중 스톱으로 설정하고, 최저 지점을 다중 스톱으로 설정한다.
전략적 이점
- 신호 명확성: 거래 신호로 EMA 교차를 사용하여 기준을 객관적으로 명확하게 판단하고 주관적인 추측을 피하십시오.
- 동적 관리: 변동의 높고 낮은 지점을 동적으로 조정하여 시장의 변동적 특성에 맞게 중지 중지 손실 위치를 조정합니다.
- 위험 조절 가능: 거래마다 명확한 스톱로스 위치가 있어 위험을 효과적으로 제어할 수 있다.
- 트렌드 추적: EMA의 트렌드 특성을 통해 중·장기 트렌드를 더 잘 파악할 수 있다.
- 매개 변수 최적화: 핵심 매개 변수는 조정할 수 있으며, 다양한 시장 특성에 따라 최적화 할 수 있습니다.
전략적 위험
- 흔들리는 시장 손실: 가로판 흔들리는 시장에서, 자주 교차하는 것은 연속적인 손실을 초래할 수 있다.
- 지연 위험: EMA가 지연되어 있고, 트렌드 초반의 중요한 가격 지점을 놓칠 수 있다.
- 가짜 브레이크 위험: 단기 가격 변동으로 인해 가짜 브레이크가 발생할 수 있으며, 이는 잘못된 신호로 이어질 수 있습니다.
- 스톱 손실: 변동 극한을 스톱 손실 지점으로 사용 하 고, 어떤 경우에는 스톱 손실이 더 클 수 있습니다.
전략 최적화 방향
- 트렌드 필터 도입: 더 긴 주기 평균선 또는 트렌드 지표를 추가하여 흔들리는 시장의 거래 신호를 필터링 할 수 있습니다.
- 개조 시점: RSI와 같은 변동 지표와 결합하여 더 우수한 가격 위치에 진입한다.
- 최적화 중지 설정: ATR를 사용하여 동적으로 중지 거리를 조정하여 풍력 관리를 더 유연하게 만들 수 있습니다.
- 거래량 확인: 거래량 분석을 추가하여 신호 신뢰도를 높인다.
- 탈퇴 메커니즘의 개량: 이동 스톱을 도입하는 것과 같은 보다 세밀한 탈퇴 조건을 설계한다.
요약하다
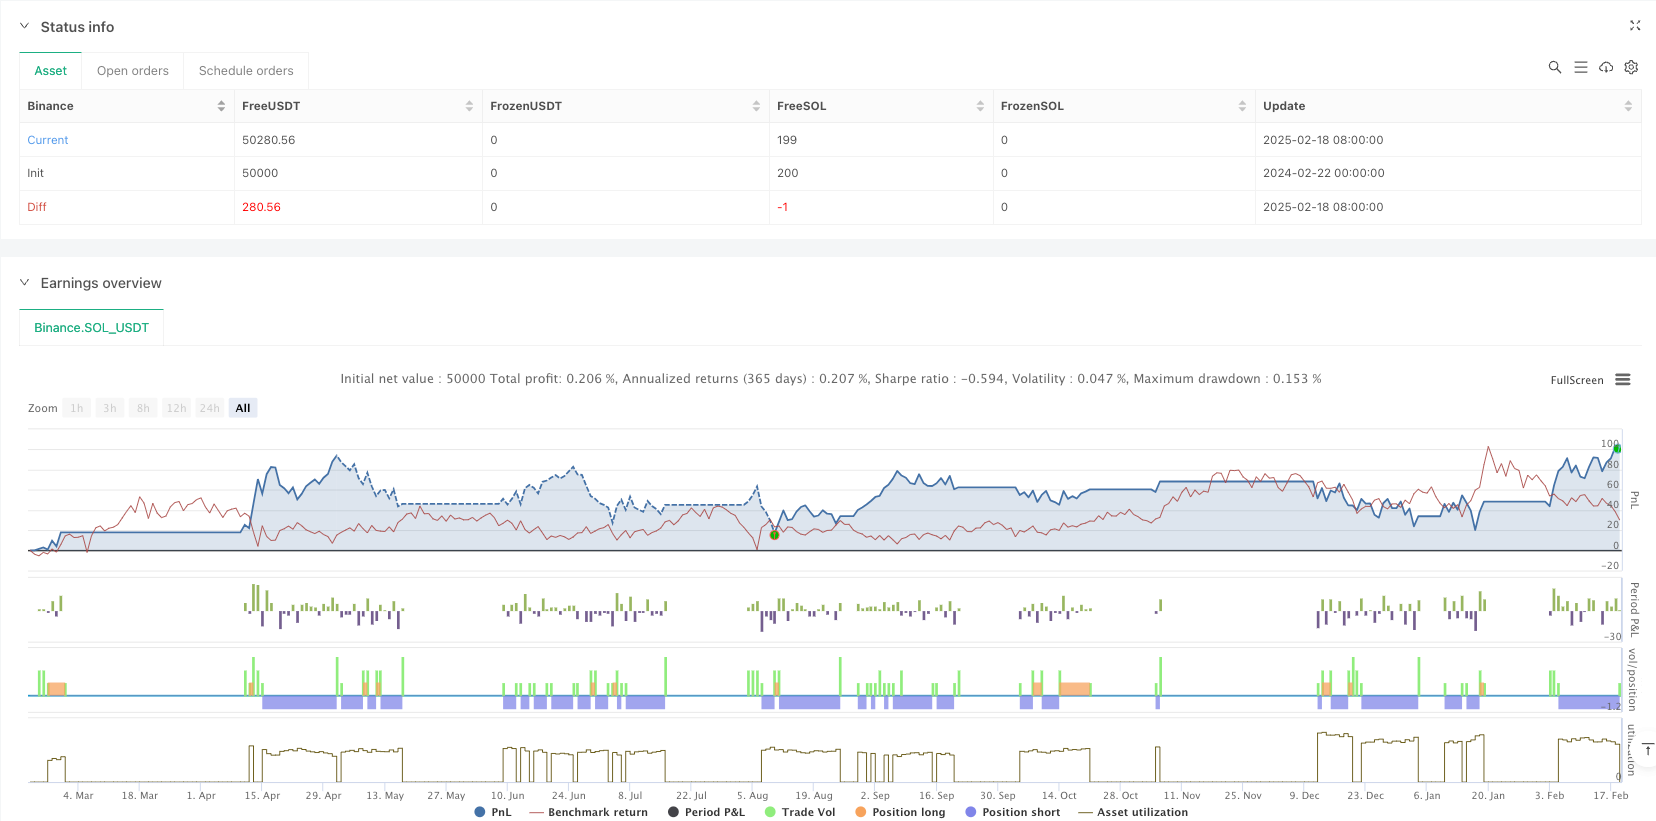
이는 구조가 완전하고 논리가 명확한 트렌드 추적 전략이다. EMA를 통해 트렌드를 교차 캡처하고, 변동성 높은 낮은 지점으로 위험을 관리하는 것이 실용성이 좋다. 일부 고유한 한계가 있음에도 불구하고, 제안된 최적화 방향을 통해 전략의 안정성과 수익성을 더욱 향상시킬 수 있다. 전략의 전체적인 설계 사상은 정량 거래의 핵심 원칙에 부합하며, 깊이 연구하고 실천할 가치가 있는 거래 시스템이다.
전략 소스 코드
/*backtest
start: 2024-02-22 00:00:00
end: 2025-02-19 08:00:00
period: 1d
basePeriod: 1d
exchanges: [{"eid":"Binance","currency":"SOL_USDT"}]
*/

// This Pine Script™ code is subject to the terms of the Mozilla Public License 2.0 at https://mozilla.org/MPL/2.0/
// © GlenMabasa

//@version=6
strategy("33 EMA Crossover Strategy", overlay=true)

// Input for the EMA length
ema_length = input.int(33, title="EMA Length")

// Calculate the 33-day Exponential Moving Average
ema_33 = ta.ema(close, ema_length)

// Plot the 33 EMA
plot(ema_33, color=color.blue, title="33 EMA", linewidth=2)

// Buy condition: Price crosses and closes above the 33 EMA
buy_condition = ta.crossover(close, ema_33) and close > ema_33

// Sell condition: Price crosses or closes below the 33 EMA
sell_condition = ta.crossunder(close, ema_33) or close < ema_33

// Swing high and swing low calculations
swing_high_length = input.int(14, title="Swing High Lookback")
swing_low_length = input.int(14, title="Swing Low Lookback")
swing_high = ta.highest(high, swing_high_length) // Previous swing high
swing_low = ta.lowest(low, swing_low_length)    // Previous swing low

// Profit target and stop loss for buys
buy_profit_target = swing_high
buy_stop_loss = swing_low

// Profit target and stop loss for sells
sell_profit_target = swing_low
sell_stop_loss = swing_high

// Plot buy and sell signals
plotshape(series=buy_condition, title="Buy Signal", location=location.belowbar, color=color.green, style=shape.labelup, text="BUY")
plotshape(series=sell_condition, title="Sell Signal", location=location.abovebar, color=color.red, style=shape.labeldown, text="SELL")

// Strategy logic for backtesting
if (buy_condition)
    strategy.entry("Buy", strategy.long)
    strategy.exit("Take Profit/Stop Loss", "Buy", limit=buy_profit_target, stop=buy_stop_loss)

if (sell_condition)
    strategy.entry("Sell", strategy.short)
    strategy.exit("Take Profit/Stop Loss", "Sell", limit=sell_profit_target, stop=sell_stop_loss)