다중 지표 융합 적응형 추세 거래 전략

2
Follow
502
Followers
개요
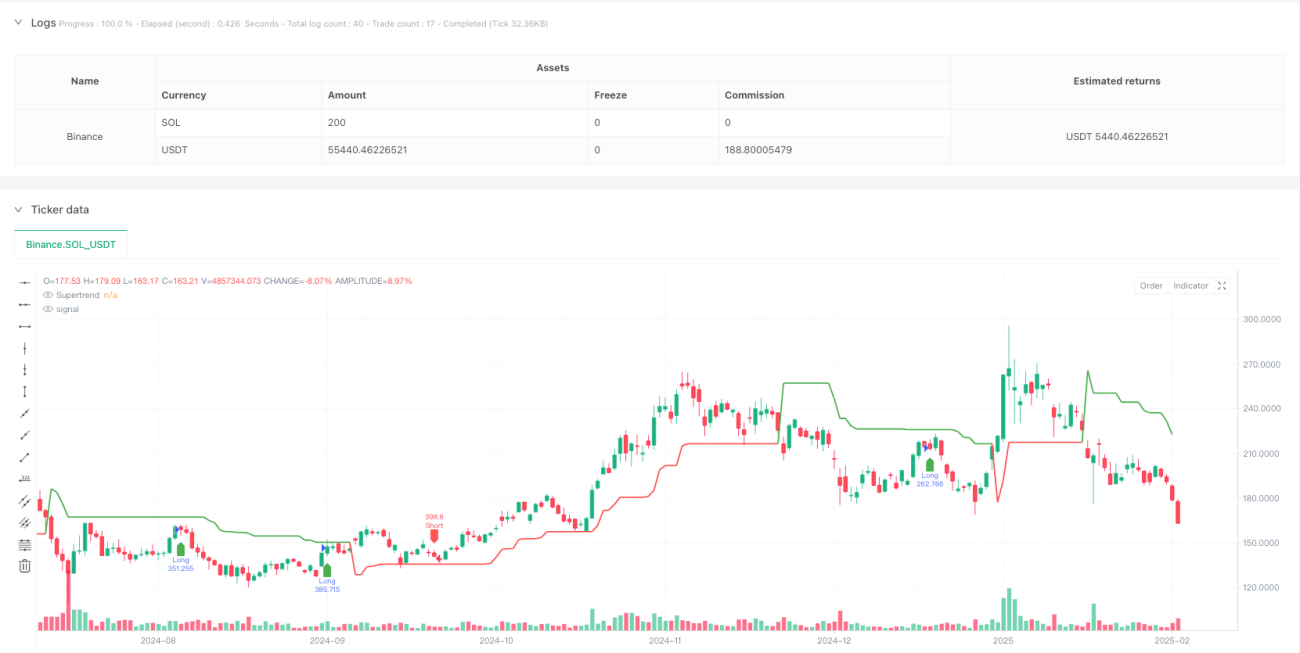
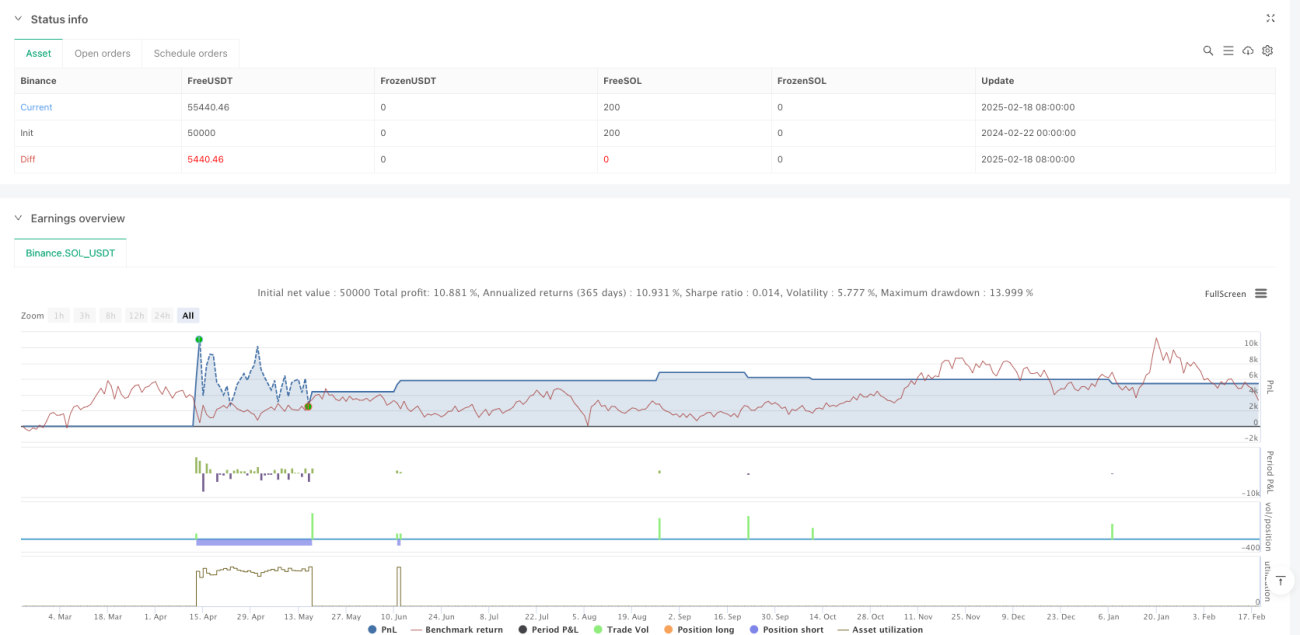
해당 전략은 여러 기술 지표를 융합한 적응형 추세 추적 거래 시스템입니다. 이동평균선 시스템(EMA), 모멘텀 지표(RSI), 추세 지표(MACD) 및 SuperTrend를 결합하여 신호를 확인하고, 손절매, 이익실현 및 이동 손절매 기능을 포함한 완벽한 위험 관리 메커니즘을 갖추고 있습니다. 전략은 시장 변동성을 충분히 고려하여, 다중 신호 필터링과 위험 제어를 통해 거래의 안정성과 신뢰성을 높입니다.
전략 원리
전략은 다층 신호 확인 메커니즘을 사용합니다:
- 9주기와 21주기 EMA의 교차를 통해 초기 추세 방향 결정
- RSI(14)를 사용하여 과매수/과매도 필터링, 매수 신호는 RSI>40 및 <70, 매도 신호는 RSI<60 및 >30 요구
- MACD 지표가 추세 모멘텀을 확인하며, 신호선과 MACD선 방향이 일치해야 함
- SuperTrend 지표는 추가 추세 확인 제공
- 위험 관리는 5% 손절매, 10% 이익실현, 2% 추적 손절매 및 1% 원금 보호 지점 사용
모든 조건이 동시에 충족될 때만 거래 신호가 발생하여, 잘못된 돌파로 인한 위험을 효과적으로 낮춥니다.
전략 장점
- 다중 신호 확인 메커니즘으로 잘못된 신호 간섭을 현저히 줄임
- 완벽한 위험 관리 체계, 고정 손절매, 이동 손절매 및 원금 보호 손절매 포함
- 전략은 적응성이 뛰어나 다양한 시장 환경에 대응 가능
- 진입 및 청산 로직이 명확하여 이해와 유지보수가 용이함
- 거래 로직은 견고한 이론적 기반을 가지며, 각 지표는 특정 기능을 수행
전략 위험
- 다중 신호 확인으로 인해 중요한 거래 기회를 놓칠 수 있음
- 급변하는 시장에서 고정 손절매 지점이 유연하지 않을 수 있음
- 매개변수 최적화는 과거 데이터에 과적합될 가능성이 있음
- 여러 지표가 횡보장에서 혼란스러운 신호를 생성할 수 있음
해결 방안: 손절매 매개변수를 동적으로 조정, 변동성 지표 도입, 정기적인 매개변수 재최적화 등이 포함됨.
전략 최적화 방향
- 적응형 매개변수 메커니즘 도입, 시장 변동성에 따라 각 매개변수 동적 조정
- 거래량 지표를 보조 확인 도구로 추가
- 손절매 메커니즘 최적화, ATR 기반 동적 손절매 도입
- 시장 환경 인식 모듈 추가, 다양한 시장 조건에서 다른 매개변수 조합 사용
- 머신러닝 기반 매개변수 최적화 시스템 개발
요약
해당 전략은 다차원 기술 지표의 협력을 통해 견고한 거래 시스템을 구축합니다. 완벽한 위험 관리 메커니즘과 명확한 거래 로직은 실용성을 높입니다. 일부 최적화 여지는 있지만, 전략의 기본 프레임워크는 견고한 이론적 기반을 가지며, 지속적인 최적화와 개선을 통해 거래 성과를 더욱 향상시킬 수 있을 것입니다.
Source
Pine
/*backtest
start: 2024-02-22 00:00:00
end: 2025-02-19 08:00:00
period: 1d
basePeriod: 1d
exchanges: [{"eid":"Binance","currency":"SOL_USDT"}]
*/

//@version=5
strategy("Optimized BTC Trading Strategy v2", overlay=true, default_qty_type=strategy.percent_of_equity, default_qty_value=100, commission_type=strategy.commission.percent, commission_value=0.1)

// Input parametersStrategy parameters
Related strategies
Comment
All comments (0)
No data
- 1