
2
Follow
475
Followers
개요
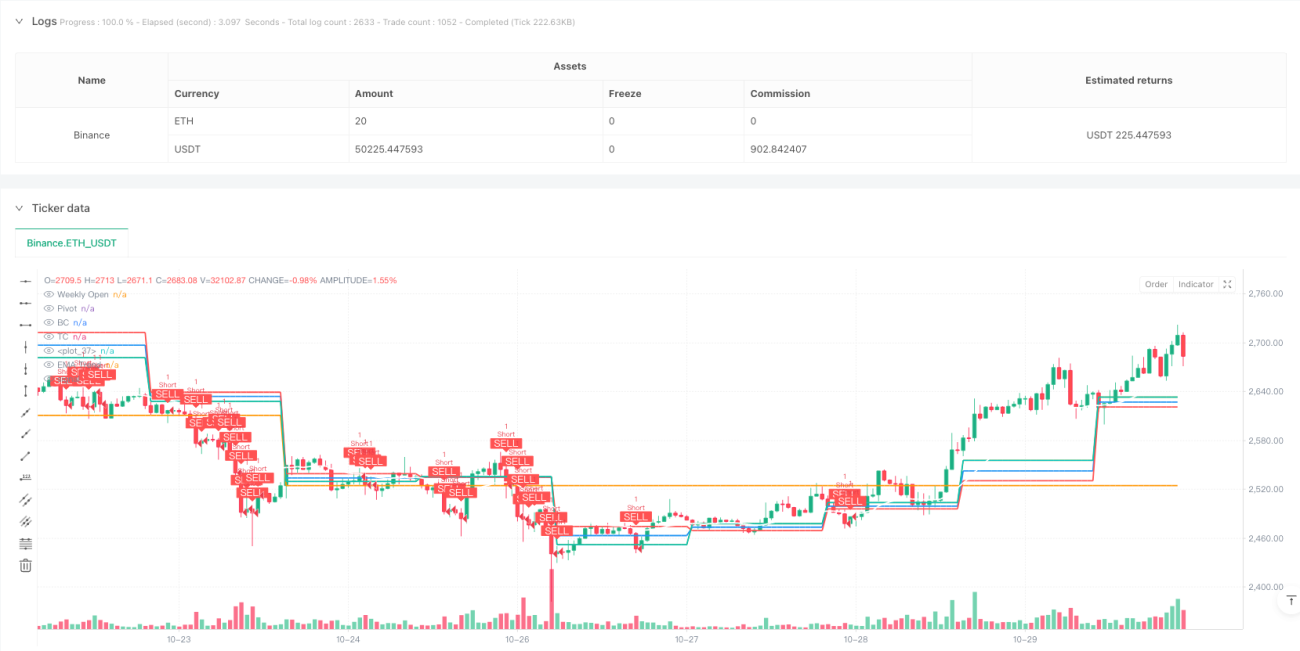
이 전략은 중추 가격 간격 (CPR), 지수 이동 평균 (EMA) 및 상대적으로 강한 지표 (RSI) 를 활용하여 거래하는 다중 시간 주기의 분석에 기반한 거래 시스템입니다. 이 전략은 일간 CPR 수준, 주간 오픈 가격 및 20 주기의 EMA를 통해 시장 추세와 중요한 지지 저항 지점을 식별하고 거래량을 확인하는 합성 거래를 수행합니다.
전략 원칙
이 전략의 핵심은 가격과 CPR 레벨의 관계를 분석하여 거래 기회를 찾는 것입니다. CPR은 축점 ((Pivot), 하위 중심선 ((BC) 및 상위 중심선 ((TC) 으로 구성됩니다. 가격이 TC를 돌파하고 시장이 다단계 단계에있을 때 시스템은 여러 신호를 냅니다. 가격이 BC를 넘어 시장이 공백 단계에있을 때 시스템은 공백 신호를 냅니다.
전략적 이점
- 다중 확인 메커니즘: 가격 행동, 트렌드 방향 및 거래량 삼중 확인을 결합하여 거래 신호의 신뢰성을 향상시킵니다.
- 다이내믹 리스크 관리: CPR 폭을 기반으로 설정된 다이내믹 스톱 로즈, 다양한 시장 환경에 적응
- 유연한 사용자 지정 옵션: CPR 시간 주기, EMA 길이는 조정할 수 있으며 RSI 오차 확인을 켜고/폐지할 수 있습니다.
- 비대칭 수익률: 1.5:1의 수익 위험 비율을 적용하여 장기 수익성을 향상시킵니다.
- 다중 시간 주기 분석: 일선 및 주기 데이터를 통합하여 더 포괄적인 시장 관점을 제공합니다.
전략적 위험
- 허위 돌파 위험: 위기 시장에서 허위 돌파 신호가 발생할 수 있으며, 더 엄격한 거래량 필터링 조건을 사용하는 것이 좋습니다.
- 트렌드 역전 위험: 트렌드 역전 지점에서 큰 회전이 발생할 수 있으며, 스톱 레인지를 축소하여 위험을 제어할 수 있습니다.
- 변수 민감성: 전략 성능은 EMA 길이 및 거래량 하락과 같은 변수에 민감하며, 주기적으로 최적화가 필요합니다.
- 시장 환경 의존성: 낮은 변동성 환경에서 예상 수익과 위험 비율을 달성하기 어려울 수 있습니다.
- 실행 슬라이드: 급속한 상황에서는 실제 거래의 효과에 영향을 미치는 큰 슬라이드를 직면 할 수 있습니다.
전략 최적화 방향
- 변동율 자조제도 도입: 시장 변동율에 따라 역동적으로 조정되는 스톱로스 및 수익 목표
- 시장 상태 분류를 추가합니다: 트렌드를 세분화하고 다른 거래 매개 변수를 사용하여 시장을 정리합니다.
- 트래픽 필터를 최적화: 단순한 평균보다 상대적인 트래픽 변화를 고려한다
- 출전 메커니즘을 개선: 이동 중지 및 일부 수익 종료 기능을 추가
- 시간 필터를 추가: 시장 개시 및 종료 전과 후의 높은 변동 기간과 같은 특정 시간 동안 거래를 피하십시오.
요약하다
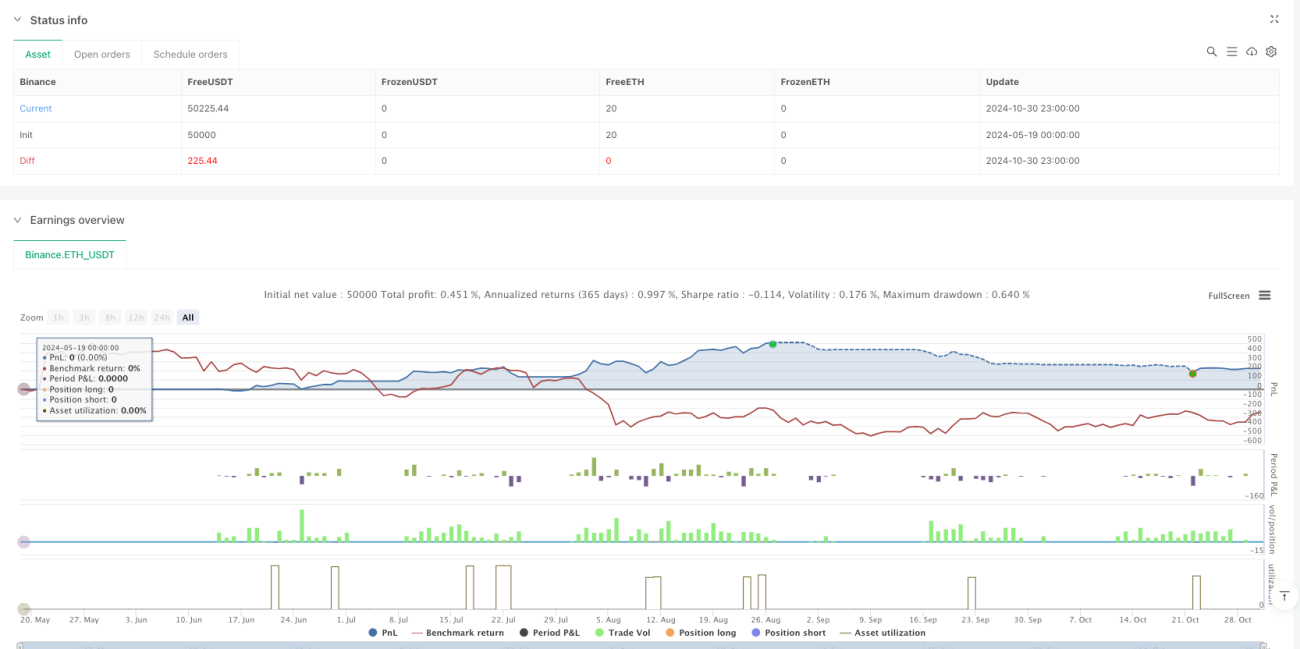
이것은 구조적이고, 논리적으로 명확한 트렌드 추적 전략으로, 여러 기술적 지표의 조합 사용으로 거래 위험을 효과적으로 제어한다. 전략의 주요 장점은 유연한 파라미터 설정과 완벽한 위험 관리 장치에 있다. 그러나 동시에 거래자는 시장 환경의 변화에 주의를 기울이고 전략 매개 변수를 적시에 조정해야 한다. 제안된 최적화 방향으로 전략의 안정성과 수익성은 더욱 향상될 것으로 보인다.
Source
Pine
//@version=5
strategy("Ahmad Ali Khan CPR Strategy", overlay=true, margin_long=100, margin_short=100)

// ———— Inputs ————
use_daily_cpr = input.bool(true, "Use Daily CPR Levels")
ema_length = input.int(20, "EMA Trend Filter Length")
show_week_open = input.bool(true, "Show Weekly Open Price")
enable_divergence = input.bool(true, "Enable RSI Divergence Check")

// ———— Daily CPR Calculation ————
daily_high = request.security(syminfo.tickerid, "D", high[1], lookahead=barmerge.lookahead_on)
daily_low = request.security(syminfo.tickerid, "D", low[1], lookahead=barmerge.lookahead_on)Strategy parameters
Related strategies
Comment
All comments (0)
No data
- 1