
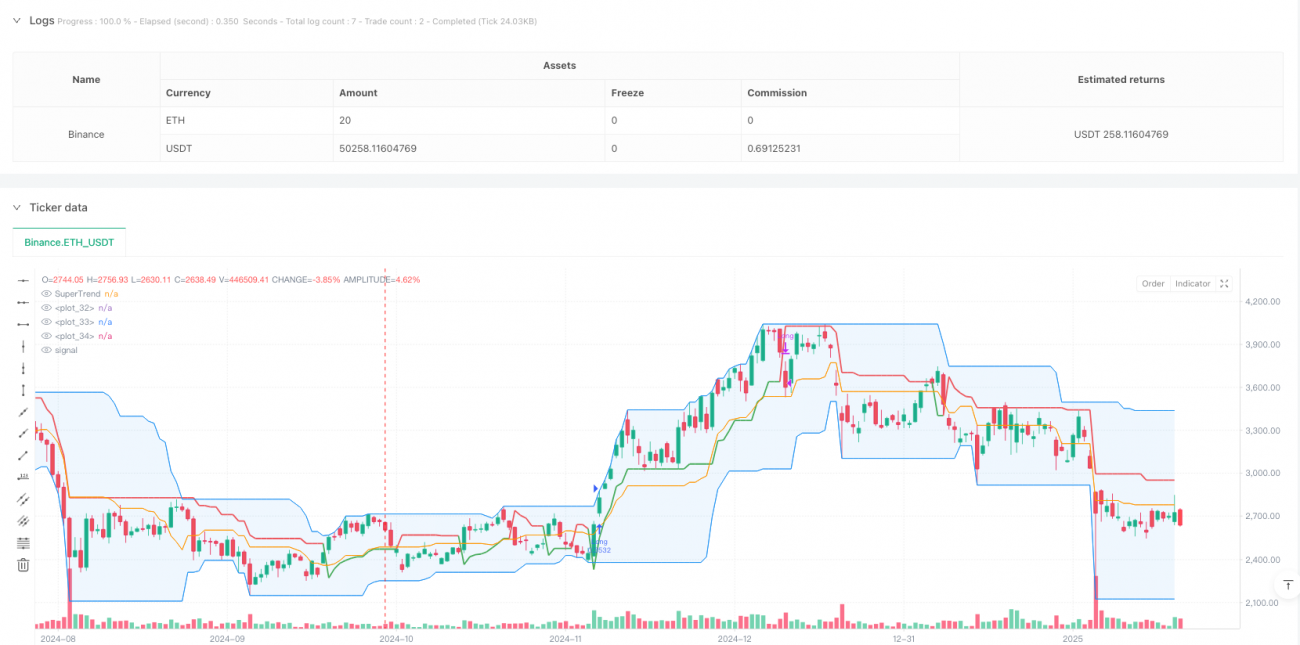
이 전략은 돈치안 채널 (Donchian Channel) 을 뚫는 트렌드 추적 거래 시스템으로, 슈퍼 트렌드 지표 (SuperTrend) 와 거래량 필터를 결합하여 거래 신호의 신뢰성을 강화한다. 이 전략은 주로 가격의 역사적인 최고점을 돌파하는 방법을 통해 잠재적인 다중 거래 기회를 식별하며, 거래량 확인과 트렌드 추적 지표를 사용하여 가짜 돌파 신호를 필터링한다.
전략의 핵심 논리는 다음과 같은 핵심 구성 요소를 기반으로 합니다.
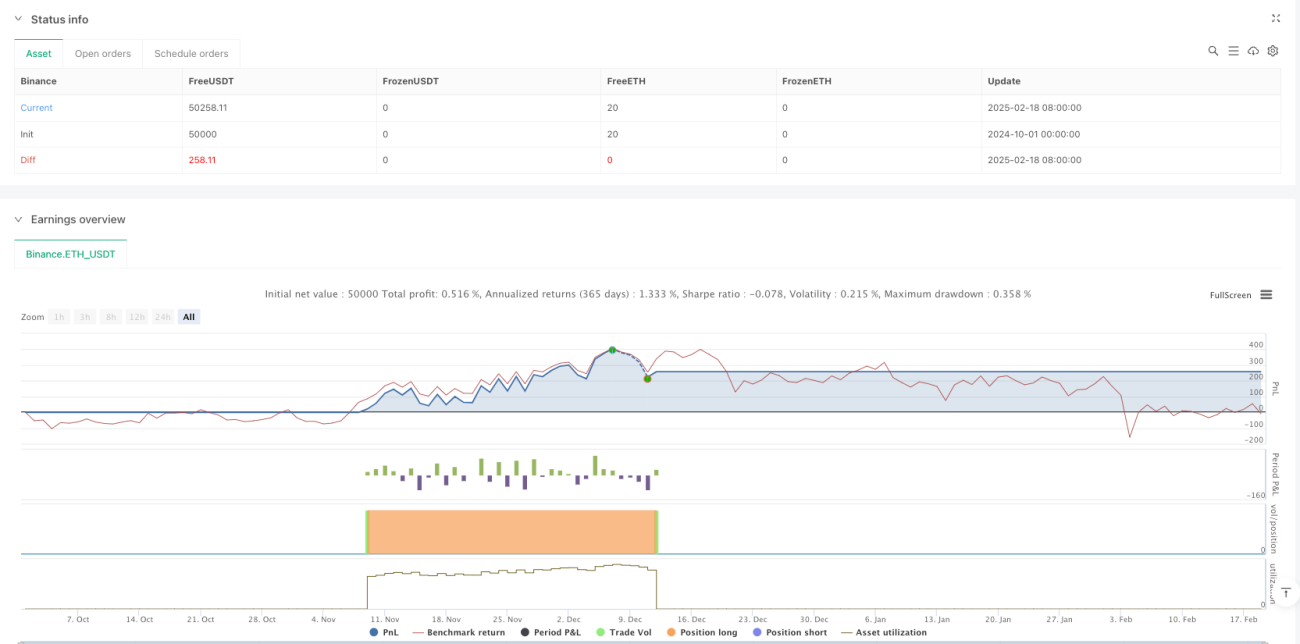
이 전략은 여러 가지 기술 지표를 통합하여 비교적 완벽한 트렌드 추적 거래 시스템을 구축했다. 이 전략의 장점은 신호의 신뢰성이 높고, 위험 관리가 유연하지만, 여전히 거래자가 특정 시장 특성에 따라 매개 변수를 최적화해야 한다는 것이다. 지속적인 개선과 최적화를 통해 이 전략은 트렌드 시장에서 안정적인 거래 효과를 얻을 것으로 보인다.
/*backtest
start: 2024-10-01 00:00:00
end: 2025-02-19 08:00:00
period: 1d
basePeriod: 1d
exchanges: [{"eid":"Binance","currency":"ETH_USDT"}]
*/
// Breakout trading system based on Donchain channel strategy that works best on a weekly chart and daily charts. Weekly is preferred.
//@version=5
strategy('Donchian BO with Volume Filter and Supertrend', shorttitle='DBO+Vol+ST', default_qty_type=strategy.percent_of_equity, default_qty_value=2, overlay=true)
// Input options to configure backtest date range
startDate = input.int(title='Start Date', defval=1, minval=1, maxval=31)
startMonth = input.int(title='Start Month', defval=1, minval=1, maxval=12)
startYear = input.int(title='Start Year', defval=2016, minval=1800, maxval=2100)
avgVol = input.int(title="Avg Volume length", defval=20)
srcInput = input.source(close, "Source")
// Volume filter toggle
useVolumeFilter = input.bool(true, title='Enable Volume Filter')
endDate = input.int(title='End Date', defval=1, minval=1, maxval=31)
endMonth = input.int(title='End Month', defval=7, minval=1, maxval=12)
endYear = input.int(title='End Year', defval=2030, minval=1800, maxval=2100)
multiplier = input.int(title='SuperTrend Mult', defval=2, minval=1, maxval=12)
stlen = input.int(title='SuperTrend Length', defval=10, minval=1, maxval=12)
length = input.int(21, minval=1)
exit = input.int(3, minval=1, maxval=4, title='Exit Option') // Use Option 1 to exit using lower band; Use Option 2 to exit using basis line
lower = ta.lowest(length)
upper = ta.highest(length)
basis = math.avg(upper, lower)
// Plotting the Donchian channel
l = plot(lower, color=color.new(color.blue, 0))
u = plot(upper, color=color.new(color.blue, 0))
plot(basis, color=color.new(color.orange, 0))
fill(u, l, color=color.new(color.blue, 90))
// Check if the current bar is in the date range
inDateRange = time >= timestamp(syminfo.timezone, startYear, startMonth, startDate, 0, 0) and time < timestamp(syminfo.timezone, endYear, endMonth, endDate, 0, 0)
// Long trailing stop-loss percentage
longTrailPerc = input.float(title='Trail Long Loss (%)', minval=0.0, step=0.1, defval=3) * 0.01
longStopPrice = 0.0
longStopPrice := if strategy.position_size > 0
stopValue = close * (1 - longTrailPerc)
math.max(stopValue, longStopPrice[1])
else
0
// Volume filter: 20-period moving average
volumeMA = ta.sma(volume, avgVol)
// Long entry condition: Donchian breakout + volume filter
longCondition = ta.crossover(srcInput, upper[1]) and (not useVolumeFilter or volume > volumeMA)
longsma = ta.sma(close, 200)
if inDateRange and longCondition
strategy.entry('Long', strategy.long)
// Exit conditions
if inDateRange and exit == 1
if ta.crossunder(close, lower[1])
strategy.close('Long')
if inDateRange and exit == 2
if ta.crossunder(close, basis[1])
strategy.close('Long')
[superTrend, dir] = ta.supertrend(multiplier, stlen)
if inDateRange and exit == 3
if ta.crossunder(close, superTrend)
strategy.close('Long')
if inDateRange and exit == 4
if strategy.position_size > 0
strategy.exit(id='XL TRL STP', stop=longStopPrice)
// Short conditions (commented out for now)
shortCondition = ta.crossunder(close, lower[1])
// Exit all positions when date range ends
if not inDateRange
strategy.close_all()
// --- Add Supertrend Indicator ---
stColor = dir == 1 ? color.red : color.green
plot(superTrend, color=stColor, title="SuperTrend", linewidth=2)