
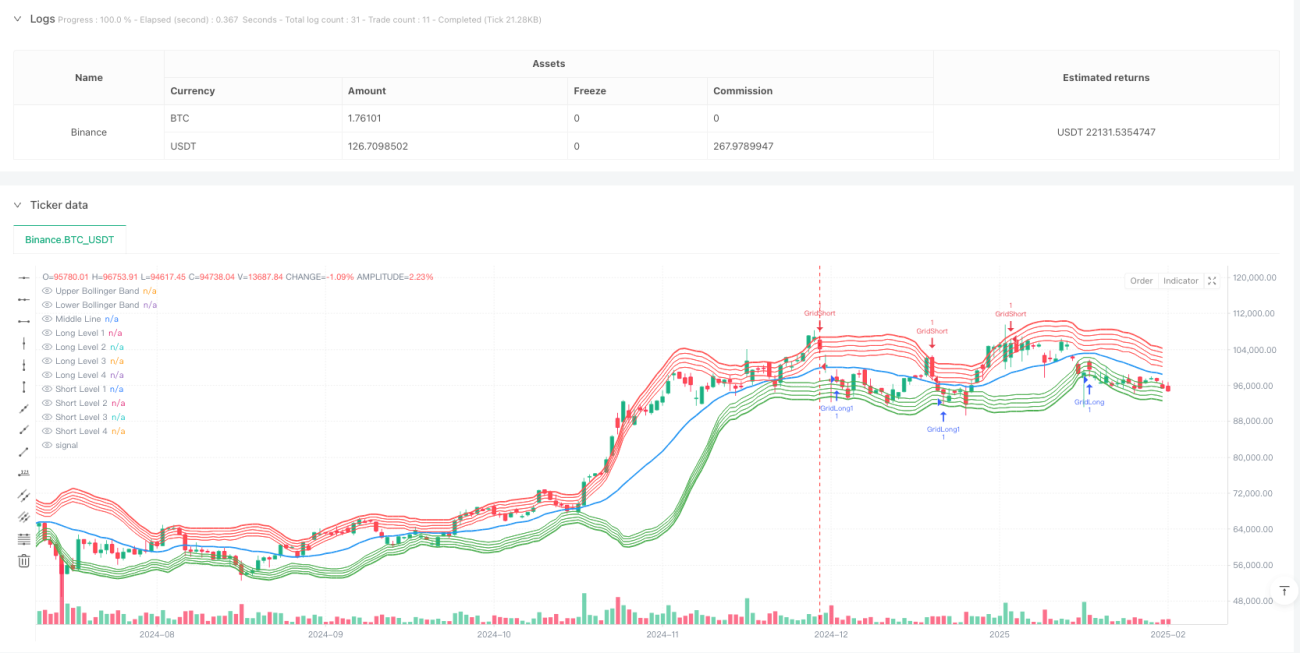
이것은 부린 띠 지표에 기반한 고급 격자 거래 전략이다. 이 전략은 부린 띠의 위아래와 중간에 있는 격자 역동성을 통해 격자의 위치를 결정하고, 시장의 변동성에 따라 자동으로 격자 간격을 조정한다. 시스템은 가격이 격자선을 돌파할 때 그에 따른 다중 격자 거래를 수행하여 완전히 자동화된 격자 거래를 실현한다.
이 전략은 20주기의 이동 평균을 브린띠의 중간 궤도로, 2배의 표준 차이를 대역폭으로 사용한다. 브린띠 기반에서, 전략은 위아래 궤도 사이에 4개의 격자 계층을 설정하고, 격자 간격은 1%이다. 가격이 위아래로 어떤 격자선을 돌파할 때, 시스템은 여러 작업을 수행한다. 가격이 하향으로 어떤 격자선을 돌파할 때, 시스템은 공백 작업을 수행한다. 이 디자인은 전략이 흔들리는 시장에서 지속적으로 수익을 올릴 수 있도록 한다.
해결책:
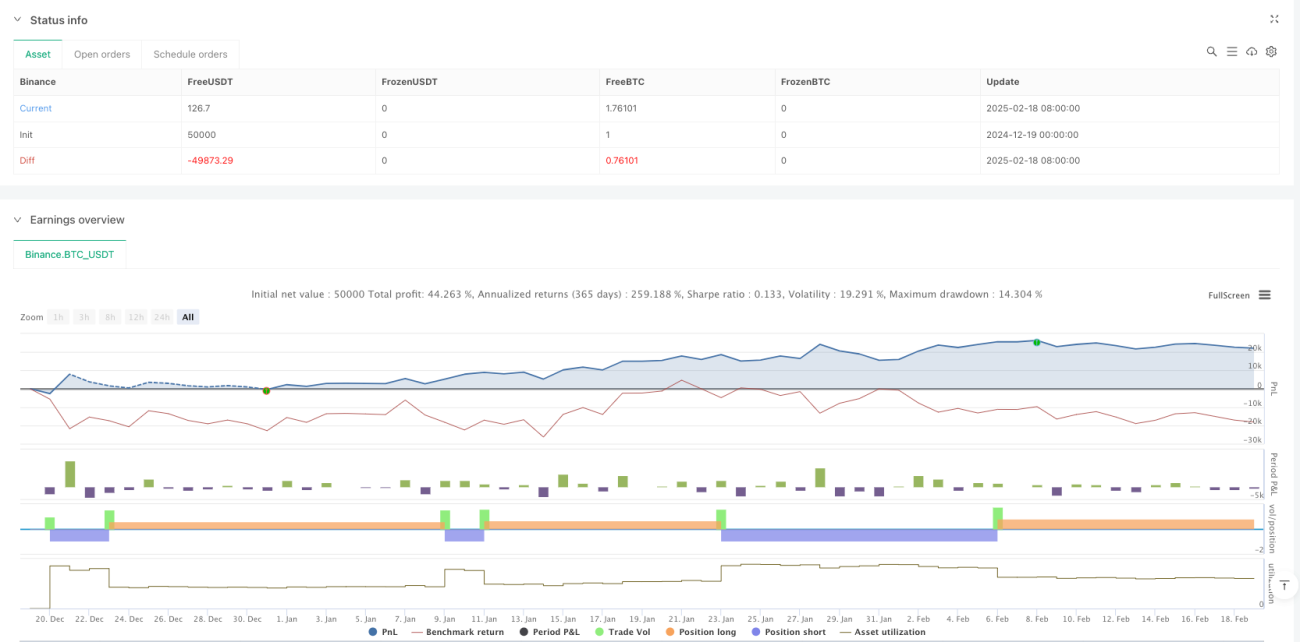
이 전략은 브린띠와 격자 거래의 결합을 통해 유연성과 안정성을 겸비한 자동화 거래 시스템을 구현한다. 전략의 핵심 장점은 다양한 시장 환경에 적응할 수 있다는 점과 동시에 매개 변수를 조정하여 위험을 통제하는 데 있다. 일부 고유한 위험이 존재하지만, 지속적인 최적화와 개선을 통해 더욱 안정적인 거래 시스템을 구축할 수 있다.
/*backtest
start: 2024-12-19 00:00:00
end: 2025-02-19 08:00:00
period: 1d
basePeriod: 1d
exchanges: [{"eid":"Binance","currency":"BTC_USDT"}]
*/
//@version=6
strategy("Grid Bot based on Bollinger Bands with Adjustable Levels", overlay=true)
// Settings
source = close
length = input.int(20, minval=1, title="Bollinger Bands Length")
mult = input.float(2.0, minval=0.001, maxval=50, title="Bollinger Bands Multiplier")
gridDistancePercent = input.float(1.0, title="Distance Between Levels (%)") / 100 // Distance between grid levels in percentage
gridSize = input.int(4, title="Number of Grid Levels") // Number of grid levels
// Bollinger Bands Calculation
basis = ta.sma(source, length)
dev = mult * ta.stdev(source, length)
upper = basis + dev
lower = basis - dev
// Middle line between the upper and lower Bollinger Bands
middle = (upper + lower) / 2
// Levels for long and short positions
var float[] longLevels = array.new_float(gridSize)
var float[] shortLevels = array.new_float(gridSize)
// Filling levels for long and short positions
for i = 0 to gridSize - 1
array.set(longLevels, i, lower * (1 + gridDistancePercent * (i + 1))) // For longs, increase the lower band
array.set(shortLevels, i, upper * (1 - gridDistancePercent * (i + 1))) // For shorts, decrease the upper band
// Logic for entering a long position (buy) at the first level crossover
longCondition = ta.crossover(source, array.get(longLevels, 0)) // Condition for buying — crossover with the first long level
if longCondition
strategy.entry("GridLong", strategy.long, comment="GridLong")
// Logic for entering a short position (sell) at the first level crossunder
shortCondition = ta.crossunder(source, array.get(shortLevels, 0)) // Condition for selling — crossunder with the first short level
if shortCondition
strategy.entry("GridShort", strategy.short, comment="GridShort")
// Logic for additional buys/sells when reaching subsequent levels
// For longs:
for i = 1 to gridSize - 1
if ta.crossover(source, array.get(longLevels, i))
strategy.entry("GridLong" + str.tostring(i), strategy.long, comment="GridLong")
// For shorts:
for i = 1 to gridSize - 1
if ta.crossunder(source, array.get(shortLevels, i))
strategy.entry("GridShort" + str.tostring(i), strategy.short, comment="GridShort")
// Visualization of the levels
plot(upper, color=color.red, linewidth=2, title="Upper Bollinger Band")
plot(lower, color=color.green, linewidth=2, title="Lower Bollinger Band")
plot(middle, color=color.blue, linewidth=2, title="Middle Line")
// Display additional grid levels (fixed titles)
plot(array.get(longLevels, 0), color=color.green, linewidth=1, title="Long Level 1") // For the 1st long level
plot(array.get(longLevels, 1), color=color.green, linewidth=1, title="Long Level 2") // For the 2nd long level
plot(array.get(longLevels, 2), color=color.green, linewidth=1, title="Long Level 3") // For the 3rd long level
plot(array.get(longLevels, 3), color=color.green, linewidth=1, title="Long Level 4") // For the 4th long level
plot(array.get(shortLevels, 0), color=color.red, linewidth=1, title="Short Level 1") // For the 1st short level
plot(array.get(shortLevels, 1), color=color.red, linewidth=1, title="Short Level 2") // For the 2nd short level
plot(array.get(shortLevels, 2), color=color.red, linewidth=1, title="Short Level 3") // For the 3rd short level
plot(array.get(shortLevels, 3), color=color.red, linewidth=1, title="Short Level 4") // For the 4th short level