동적 다중 지표 추세 추종 데이 트레이딩 전략

EMA RSI MACD ATR IST
생성 날짜: 2025-02-21 13:15:30 마지막으로 수정됨: 2025-02-21 13:15:30
복사: 0 클릭수: 365
avatar of ianzeng123 ianzeng123
2
집중하다
319
수행원

동적 다중 지표 추세 추종 데이 트레이딩 전략 동적 다중 지표 추세 추종 데이 트레이딩 전략

개요

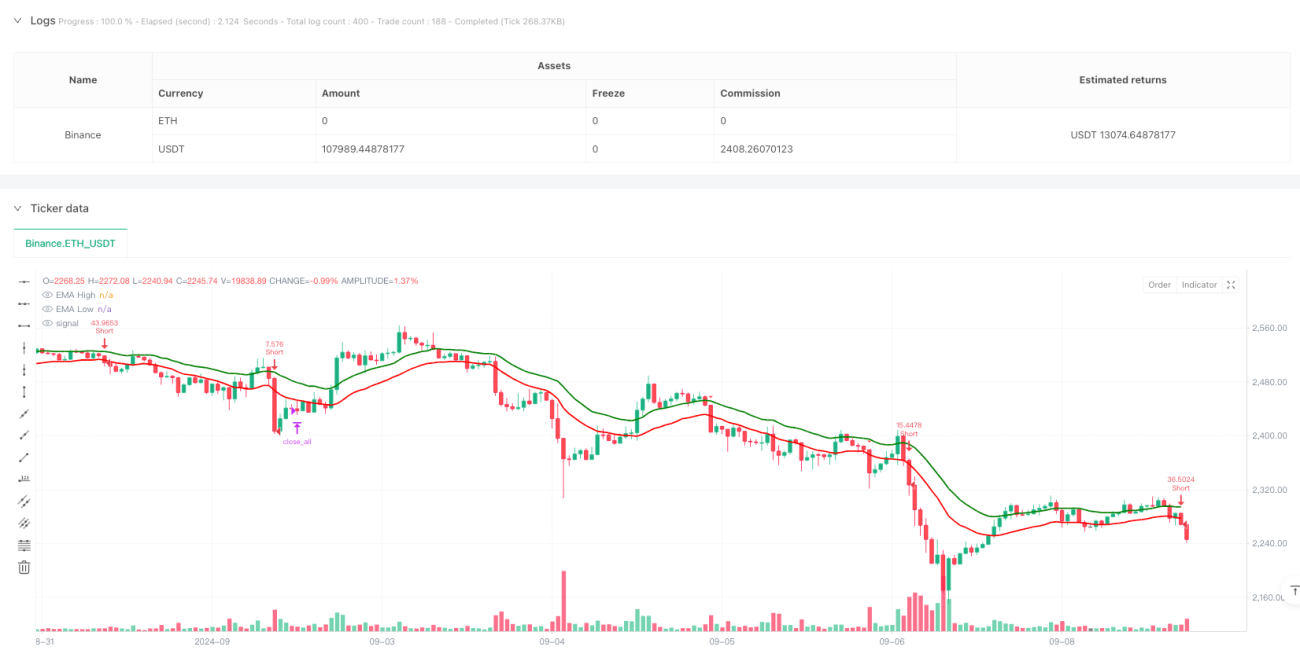
이것은 다중 기술 지표에 기반한 일일 거래 전략이며, 주로 EMA 채널, RSI 오버 바이 오버 셀, MACD 트렌드 확인 등 다중 신호를 사용하여 거래한다. 이 전략은 3분 주기적으로 작동하며, RSI와 MACD의 교차 확인을 결합한 EMA 고저 궤도를 통해 시장 트렌드를 포착하고, ATR 기반의 동적 스톱 로드 을 설정하고, 고정된 종결 평정 시간을 설정한다.

전략 원칙

전략은 20주기 EMA를 사용하여 최고 가격과 최저 가격에 대해 각각 계산하여 채널을 형성하고, 가격이 채널을 뚫고 다음 조건을 충족하면 진입한다:

  1. 다중 입점: 종결 가격에 EMA 고조선, RSI 50-70 사이, MACD 선에 신호선을 통과
  2. 공허 입시: 종결 가격 아래로 EMA 하위 궤도를 통과, RSI는 30-50 사이, MACD 선 아래로 신호선을 통과
  3. ATR를 동적으로 사용하여 스톱로스를 계산하고, 2.5배의 리스크/이익 비율에 따라 스톱을 설정
  4. 매 거래의 위험은 계좌의 1%이며, 포지션 크기는 스톱로스 거리 역동적으로 계산됩니다.
  5. 인도 표준시 (IST) 15:00까지 모든 위치에서 의무적으로 평지

전략적 이점

  1. 다중 기술 지표 교차 검증, 거래 신호 신뢰성 향상
  2. 역동적인 스톱로즈는 ATR 지표에 기반하여 시장의 변동에 더 잘 적응합니다.
  3. 고정된 위험 비율과 위험 수익 비율, 효과적인 위험 제어
  4. 거래비용을 고려하여 수수료 계산을 포함합니다.
  5. 동방위치 상장 금지, 과도한 포지션 위험 방지
  6. 매장시간을 고정하여 밤새의 위험을 피하십시오.

전략적 위험

  1. 복수의 지표로 인해 신호가 지연되어 출입 시기가 영향을 받을 수 있습니다.
  2. EMA 통로는 수평 시장에서 빈번한 가짜 돌파구를 일으킬 수 있습니다.
  3. 고정된 리스크/이익 비율은 다양한 시장 환경에서 충분히 유연하지 않을 수 있습니다.
  4. RSI 간격 제한은 큰 추세를 놓칠 수 있습니다.
  5. 강제 청산은 핵심 지점에서 강제 철수할 수 있다.

전략 최적화 방향

  1. 보조적인 확인으로 거래량 지표를 추가하는 것을 고려하십시오.
  2. 다양한 시간대에서의 변동성 특성에 따라 리스크/이익비율을 조정할 수 있다.
  3. 시장 변동성 지표의 동적 조정 RSI 하락을 도입합니다.
  4. 트렌드 강도 필터를 증가시키고 가짜 돌파구를 줄이는 것을 고려하십시오.
  5. 하루의 다른 시간적 특성에 따라 변수를 조정할 수 있습니다.
  6. 포지션 관리를 최적화하기 위해 역사적인 변동률 분석을 추가합니다

요약하다

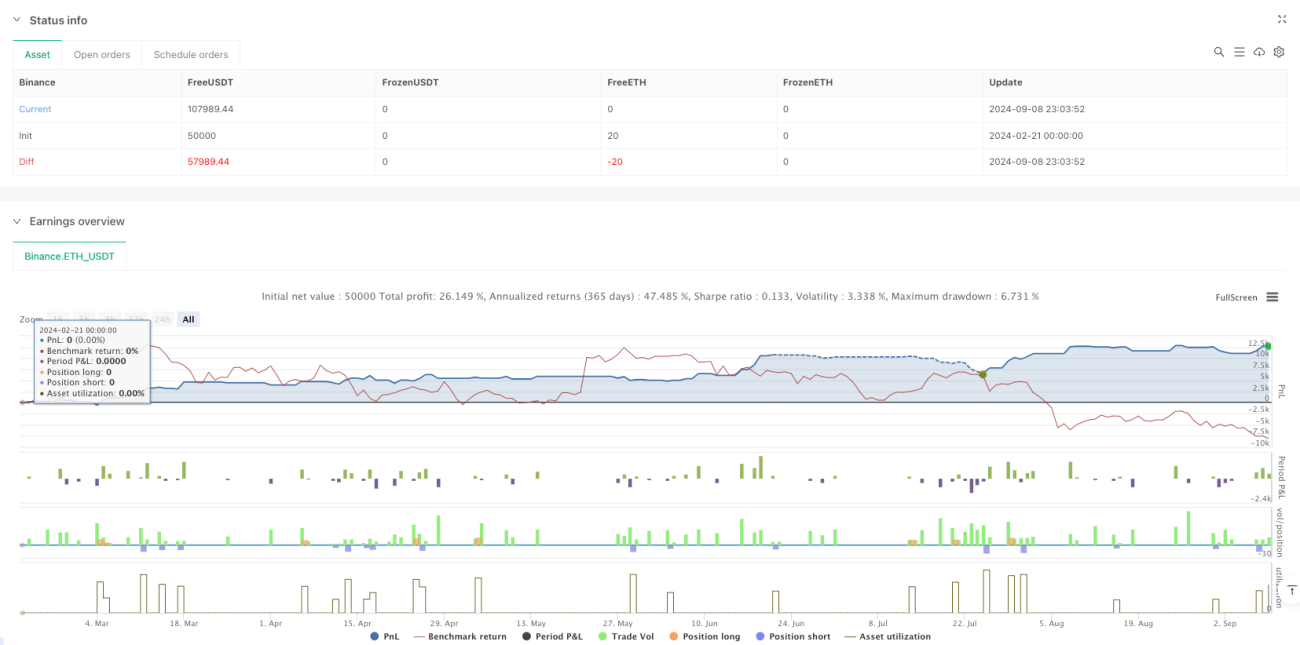
이 전략은 다중 기술 지표의 조합을 통해 비교적 완전한 거래 시스템을 구축한다. 전략의 장점은 위험 통제가 완벽하다는 데 있다. 동적 중단, 고정 위험 및 청산 청산과 같은 메커니즘이 포함된다. 약간의 지연 위험이 존재하지만, 매개 변수를 최적화하고 보조 지표를 추가하면 전략의 성능을 더욱 향상시킬 수 있다. 전략은 특히 변동성이 높은 일간 거래 시장에 적합하며, 엄격한 위험 통제와 다중 신호 확인을 통해 안정적인 수익을 얻을 수 있다.

전략 소스 코드
/*backtest
start: 2024-02-21 00:00:00
end: 2024-09-09 00:00:00
period: 1h
basePeriod: 1h
exchanges: [{"eid":"Binance","currency":"ETH_USDT"}]
*/

//@version=6
strategy("Intraday 3min EMA HL Strategy v6", 
     overlay=true,
     margin_long=100, 
     margin_short=100,
     initial_capital=100000,
     default_qty_type=strategy.percent_of_equity,
     default_qty_value=100,
     commission_type=strategy.commission.percent,
     commission_value=0.05,
     calc_on_every_tick=false,
     process_orders_on_close=true,
     pyramiding=0)

// Input Parameters
i_emaLength = input.int(20, "EMA Length", minval=5, group="Strategy Parameters")
i_rsiLength = input.int(14, "RSI Length", minval=5, group="Strategy Parameters")
i_atrLength = input.int(14, "ATR Length", minval=5, group="Risk Management")
i_rrRatio = input.float(2.5, "Risk:Reward Ratio", minval=1, maxval=10, step=0.5, group="Risk Management")
i_riskPercent = input.float(1, "Risk % per Trade", minval=0.1, maxval=5, step=0.1, group="Risk Management")

// Time Exit Parameters (IST)
i_exitHour = input.int(15, "Exit Hour (IST)", minval=0, maxval=23, group="Session Rules")
i_exitMinute = input.int(0, "Exit Minute (IST)", minval=0, maxval=59, group="Session Rules")

// Indicator Calculations
emaHigh = ta.ema(high, i_emaLength)
emaLow = ta.ema(low, i_emaLength)

rsi = ta.rsi(close, i_rsiLength)
atr = ta.atr(i_atrLength)

fastMA = ta.ema(close, 12)
slowMA = ta.ema(close, 26)
macdLine = fastMA - slowMA
signalLine = ta.ema(macdLine, 9)

// Time Calculations (UTC to IST Conversion)
istHour = (hour(time) + 5) % 24  // UTC+5
istMinute = minute(time) + 30    // 30 minute offset
istHour += istMinute >= 60 ? 1 : 0
istMinute := istMinute % 60

// Exit Condition
timeExit = istHour > i_exitHour or (istHour == i_exitHour and istMinute >= i_exitMinute)

// Entry Conditions (Multi-line formatting fix)
longCondition = close > emaHigh and
     rsi > 50 and
     rsi < 70 and
     ta.crossover(macdLine, signalLine)

shortCondition = close < emaLow and
     rsi < 50 and
     rsi > 30 and
     ta.crossunder(macdLine, signalLine)

// Risk Calculations
var float entryPrice = na
var float stopLoss = na
var float takeProfit = na
var float posSize = na

// Strategy Logic
if longCondition and not timeExit and strategy.position_size == 0
    entryPrice := close
    stopLoss := math.min(low, entryPrice - atr)
    takeProfit := entryPrice + (entryPrice - stopLoss) * i_rrRatio
    posSize := strategy.equity * i_riskPercent / 100 / (entryPrice - stopLoss)
    strategy.entry("Long", strategy.long, qty=posSize)
    strategy.exit("Long Exit", "Long", stop=stopLoss, limit=takeProfit)

if shortCondition and not timeExit and strategy.position_size == 0
    entryPrice := close
    stopLoss := math.max(high, entryPrice + atr)
    takeProfit := entryPrice - (stopLoss - entryPrice) * i_rrRatio
    posSize := strategy.equity * i_riskPercent / 100 / (stopLoss - entryPrice)
    strategy.entry("Short", strategy.short, qty=posSize)
    strategy.exit("Short Exit", "Short", stop=stopLoss, limit=takeProfit)

// Force Close at Session End
if timeExit
    strategy.close_all()

// Visual Components
plot(emaHigh, "EMA High", color=color.rgb(0, 128, 0), linewidth=2)
plot(emaLow, "EMA Low", color=color.rgb(255, 0, 0), linewidth=2)

plotshape(longCondition, "Long Signal", shape.triangleup, 
  location.belowbar, color=color.green, size=size.small)
plotshape(shortCondition, "Short Signal", shape.triangledown, 
  location.abovebar, color=color.red, size=size.small)

// Debugging Table
var table infoTable = table.new(position.top_right, 3, 3)
if barstate.islast
    table.cell(infoTable, 0, 0, "EMA High: " + str.tostring(emaHigh, "#.00"))
    table.cell(infoTable, 0, 1, "EMA Low: " + str.tostring(emaLow, "#.00"))
    table.cell(infoTable, 0, 2, "Current RSI: " + str.tostring(rsi, "#.00"))