
2
Follow
478
Followers
개요
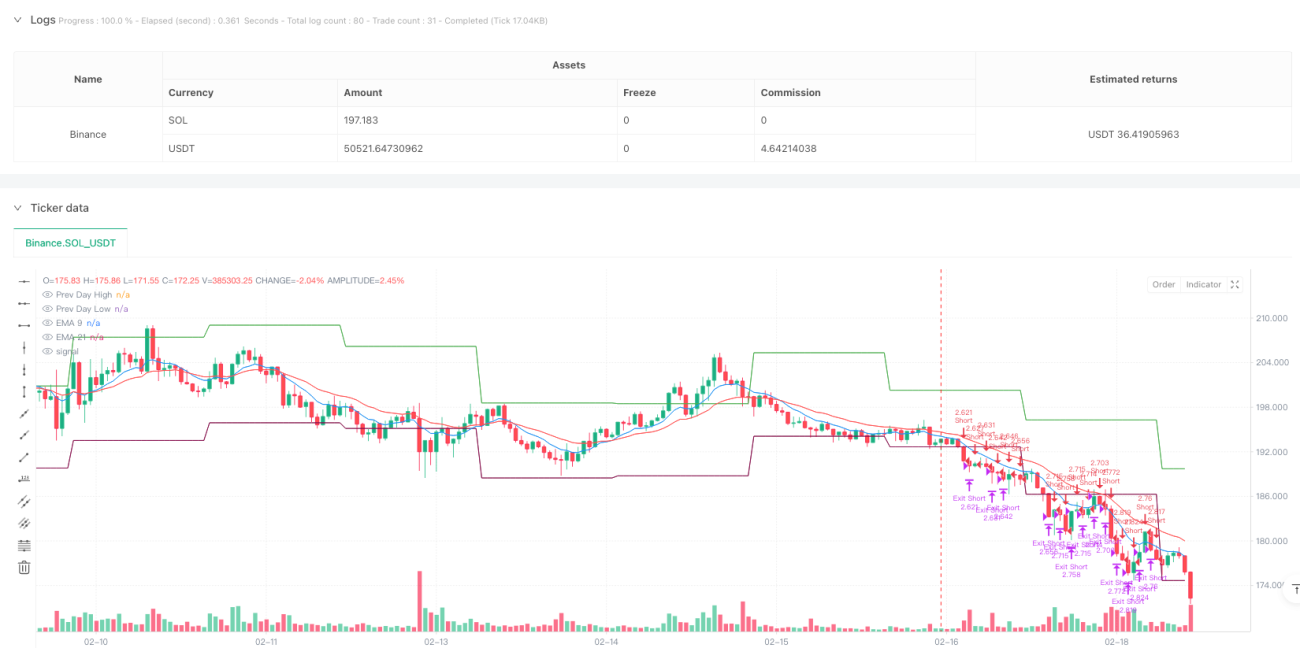
이 전략은 전날의 가격 간격 돌파와 지수 이동 평균 (EMA) 을 결합한 일일 거래 전략이다. 전략은 가격 돌파 전날의 최고점 또는 최저점 시점을 식별하여 빠르고 느린 EMA의 확인 신호와 결합하여 거래한다. 이 전략은 단기 가격 움직임을 포착하는 데 초점을 맞추고 있으며, 고정된 중지 손실 수와 리스크 수익률을 설정하여 위험을 관리한다.
전략 원칙
전략의 핵심 논리는 다음과 같은 핵심 요소에 기초합니다.
- request.security 함수를 사용하여 이전 거래일의 최고점과 최저점을 핵심 가격 범위로 가져옵니다.
- 9주기 및 21주기 지수 이동 평균을 계산하여 트렌드 확인 지표로 사용한다.
- 가격 돌파가 하루 전의 최고점이고 빠른 EMA가 느린 EMA 위에 있을 때, 더 많은 신호를 트리거한다.
- 가격 돌파가 하루 전의 하위점이고 빠른 EMA가 느린 EMA 아래에 있을 때, 마이너스 신호를 트리거한다.
- 매 거래의 위험을 관리하기 위해 고정된 스톱로스 포인트 (Stop Loss Points) 를 설정합니다. (Stop Loss Points) 는 30점이며, 리스크/이익 비율은 2.0점입니다.
- 선택적인 거래 시간 필터 기능, 특정 시간대 (SAST 시간대) 에서 거래를 지원한다.
전략적 이점
- 구조가 명확하고 논리가 간단하다: 전략은 이해하기 쉽고 실행하기 쉬운 가격 돌파 논리를 사용합니다.
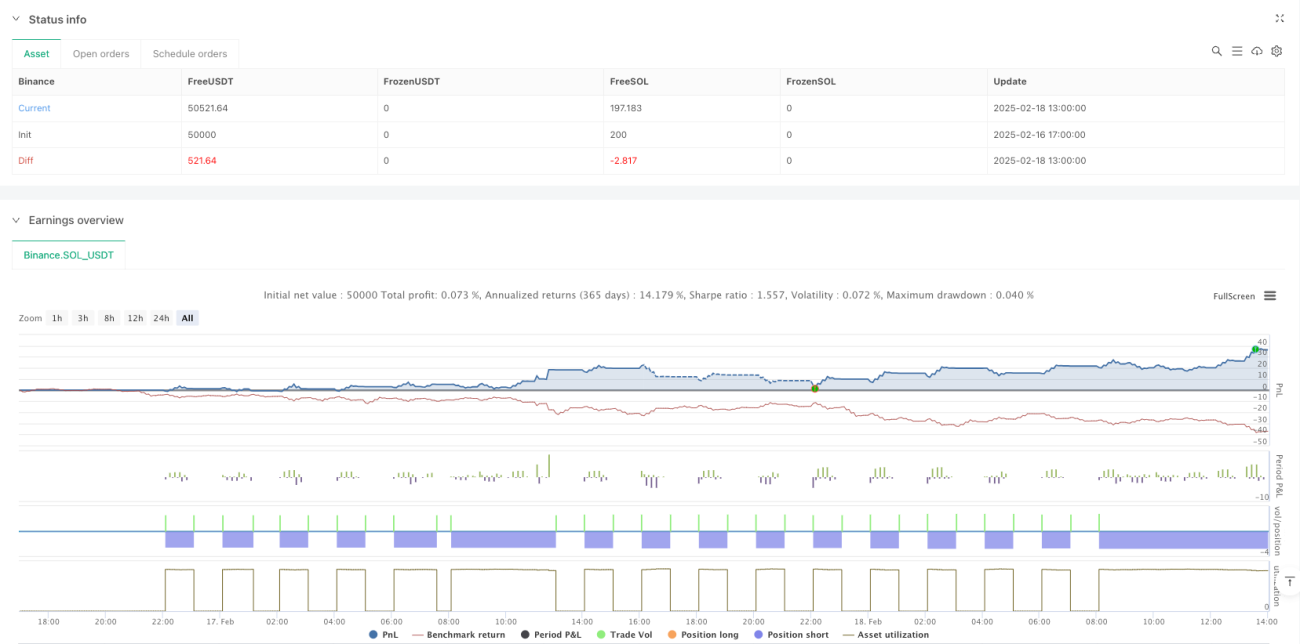
- 리스크 관리: 고정된 스톱포인트와 리스크 수익률의 설정을 통해 엄격한 리스크 통제를 실현한다.
- 유연한 시간 관리: 선택 가능한 거래 시간 필터 기능으로 가장 활발한 시장 시간에 거래를 할 수 있습니다.
- 다중 확인 메커니즘: 가격 돌파구와 EMA의 트렌드 확인을 결합하여 가짜 신호의 위험을 줄인다.
- 높은 수준의 자동화: 전략은 인간의 개입을 줄여 완전히 자동화 할 수 있습니다.
전략적 위험
- 가짜 돌파 위험: 가격이 돌파 후에 빠르게 회수되어 손실을 막는 데로 이어질 수 있다.
- 슬라이드 포인트 위험: 높은 변동 기간 동안 실제 거래 가격은 신호 가격과 현저한 편차가 있을 수 있다.
- 고정 스톱 리스크: 고정 점수의 스톱은 모든 시장 조건에 적합하지 않을 수 있습니다.
- 시장의 변동 위험: 낮은 변동성 동안 과도한 거래 신호가 발생할 수 있습니다.
전략 최적화 방향
- 동적 중지 손해 최적화: 시장의 변동에 따라 동적으로 중지 손해 점수를 조정하는 것을 고려할 수 있습니다.
- 거래 시간 최적화: 역사 데이터 분석을 통해 거래 시간 창 설정을 최적화한다.
- 신호 필터링 강화: 추가 필터링 조건으로 거래량 또는 변동률 지표를 추가한다.
- EMAs 변수 최적화: 역검사를 통해 최적의 EMAs 주기 설정을 결정한다.
- 포지션 관리 최적화: 변동율에 기반한 동적 포지션 관리 메커니즘을 도입한다.
요약하다
이 전략은 가격 돌파구와 EMA의 트렌드 확인을 결합하는 방식으로 신뢰할 수 있는 일일 거래 시스템을 구현한다. 전략의 핵심 장점은 명확한 논리 구조와 완벽한 위험 관리 장치에 있다. 전략은 제안된 최적화 방향을 통해 안정성과 수익성을 더욱 향상시킬 수 있다. 실물 거래에서는 가짜 돌파구와 슬라이드 포인트 위험에 특히 주의를 기울이고 실제 시장 조건에 따라 파라미터를 조정해야 한다.
Source
Pine
/*backtest
start: 2025-02-16 17:00:00
end: 2025-02-18 14:00:00
period: 1h
basePeriod: 1h
exchanges: [{"eid":"Binance","currency":"SOL_USDT"}]
*/

//@version=5
strategy("GER40 Momentum Breakout Scalping", overlay=true, initial_capital=10000, default_qty_type=strategy.percent_of_equity, default_qty_value=1)

//———— Input Parameters —————Strategy parameters
Related strategies
Comment
All comments (0)
No data
- 1