RSI와 양적거래의 거래량을 기반으로 한 고급 반전전략

2
Follow
478
Followers
개요
이것은 RSI 지표와 거래량에 기반한 역전 거래 전략이다. 이 전략은 시장에서 과매매 과매매 상태를 식별하여 거래량 확인을 결합하고, 가격 상태가 극단적일 때 역전 거래한다. 전략의 핵심 아이디어는 RSI 지표가 과매매 또는 과매매 신호가 나타나고 거래량이 평균 수준보다 높을 때 거래하는 것이며, RSI 중간선 ((50) 을 통해 탈퇴 신호로 사용한다.
전략 원칙
이 전략은 다음과 같은 핵심 구성 요소에 기반합니다.
- RSI 지표 계산: 14주기의 RSI 지표를 사용하여 가격 동력을 모니터링합니다.
- 거래량 확인: 20주기의 거래량 이동 평균 ((SMA) 을 사용하여
- 입력 논리:
- 다수 입점: RSI가 30보다 낮고 거래량이 이동 평균보다 많을 때
- 공허 입시: RSI가 70보다 높고 거래량이 이동 평균보다 많을 때
- 출전 논리:
- RSI에 50을 입는 다중 출장
- 헐헤드 출장: RSI 아래 50를 입었다
전략적 이점
- 체계화된 거래 결정: 명확한 기술 지표 포트폴리오를 통해 객관적인 거래 시스템을 구축
- 다중 확인 메커니즘: RSI와 거래량 두 차원을 결합하여 신호 신뢰성을 향상시킵니다.
- 리스크 관리가 완벽하다: 백분율 자금 관리를 사용하며, 재건 창고를 금지한다.
- 시각화 지원: 분석 및 모니터링을 위한 완전한 그래프 표시 기능 포함
- 적응력: 주요 매개 변수 모두 사용자 정의 가능하며, 다양한 시장 환경에 적합합니다.
전략적 위험
- 동향이 지속될 위험: 강세를 보이는 시장에서 역전 전략은 종종 손실이 발생할 수 있습니다.
- 가짜 돌파구 위험: 높은 거래량은 반드시 진정한 시장 전환을 의미하지 않는다
- 매개 변수 민감성: RSI 주기와 오버 바이 오버 세드 경계를 선택하면 전략 성과에 큰 영향을 미칩니다.
- 슬라이드 포인트 효과: 급격한 변동이 있을 때 거래 가격이 예상보다 크게 벗어날 수 있습니다.
- 자금 관리 위험: 고정 비율 포지션은 특정 시장 조건에서 너무 급진적일 수 있습니다.
전략 최적화 방향
- 트렌드 필터: 트렌드를 판단하는 지표를 도입하여 강한 트렌드 기간 동안 역거래를 피하십시오.
- 동적 변수: 시장의 변동에 따라 동적으로 조정된 RSI의 초과 구매 초과 판매
- 출장 최적화: 손실을 막고 추적하는 제도를 늘리고, 위험을 통제하는 능력을 향상시킵니다.
- 거래량 분석 강화: 거래량 형태 분석을 추가하여 신호 품질을 향상
- 시간 필터: 거래 시간 창을 추가하여 비효율적인 거래 시간을 피합니다.
요약하다
이 전략은 RSI 지표와 거래량 분석을 결합하여 완전한 역전 거래 시스템을 구축한다. 전략 설계는 합리적이며, 좋은 조작성과 유연성을 가지고 있다. 제안된 최적화 방향에 의해 전략에는 추가적인 향상할 여지가 있다. 실장 적용 시, 충분히 매개 변수를 테스트하고 시장 특성에 맞게 타겟팅 최적화를 수행하는 것이 좋습니다.
Source
Pine
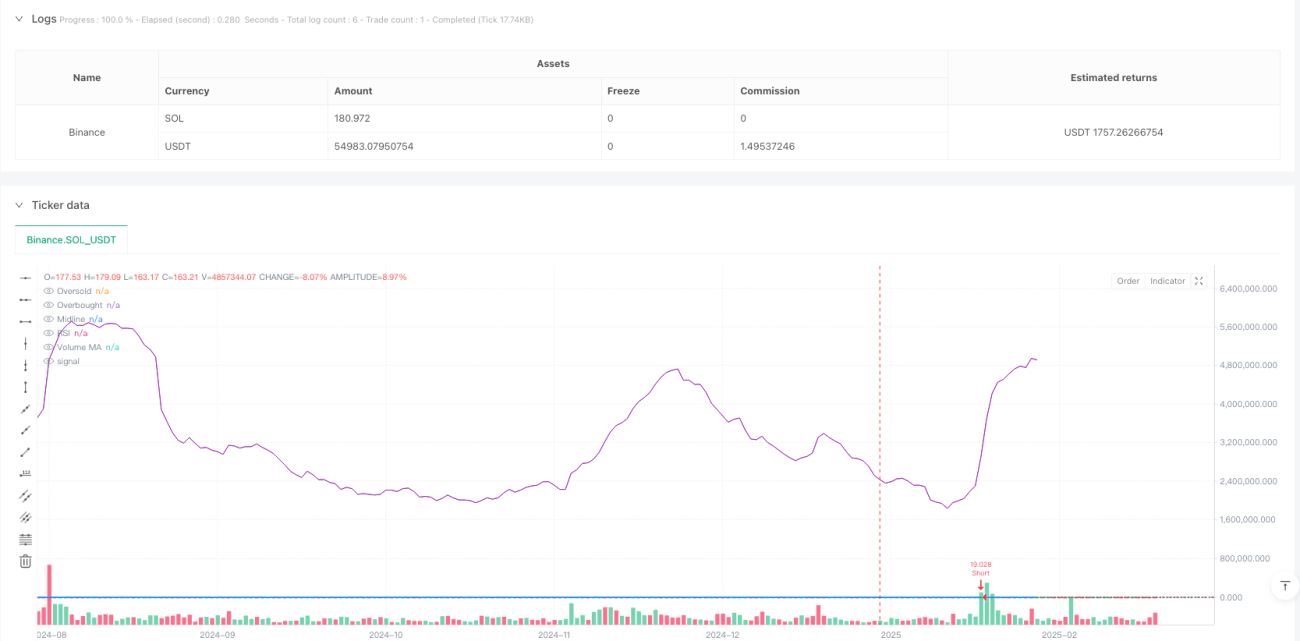
/*backtest
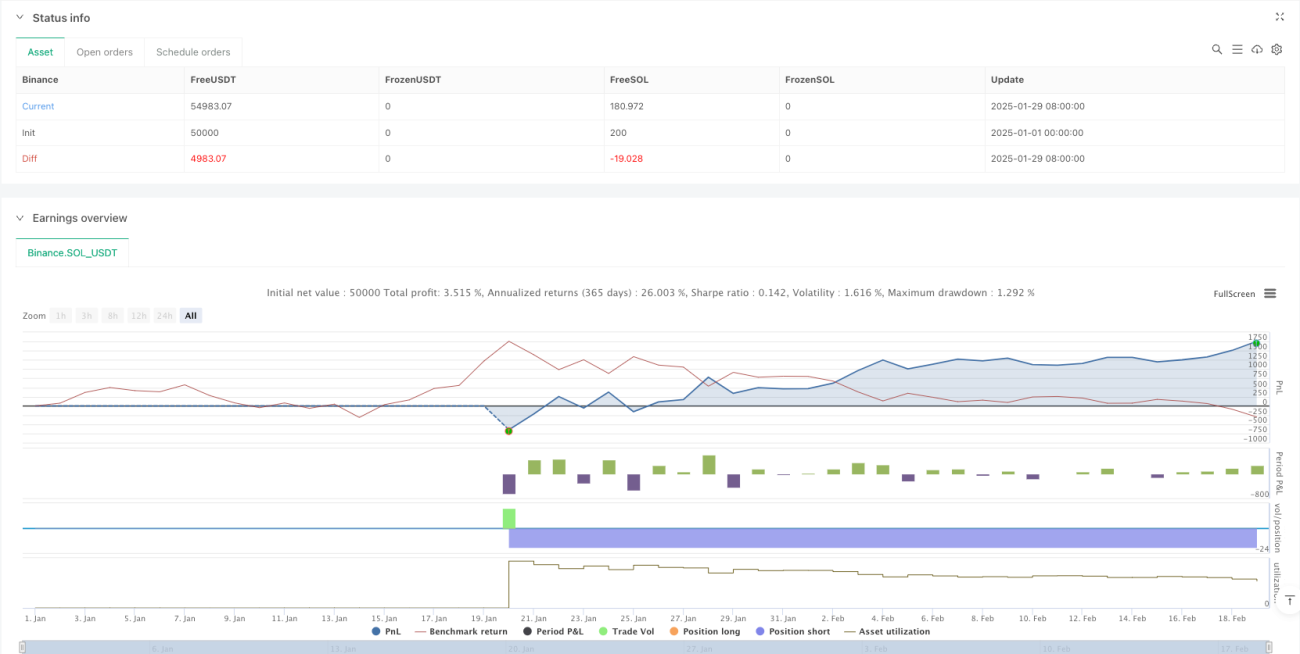
start: 2025-01-01 00:00:00
end: 2025-02-19 08:00:00
period: 1d
basePeriod: 1d
exchanges: [{"eid":"Binance","currency":"SOL_USDT"}]
*/
//@version=5
strategy("RSI & Volume Contrarian Strategy", overlay=true, initial_capital=100000, default_qty_type=strategy.percent_of_equity, default_qty_value=10, pyramiding=0)
//---------------------------Strategy parameters
Related strategies
Comment
All comments (0)
No data
- 1