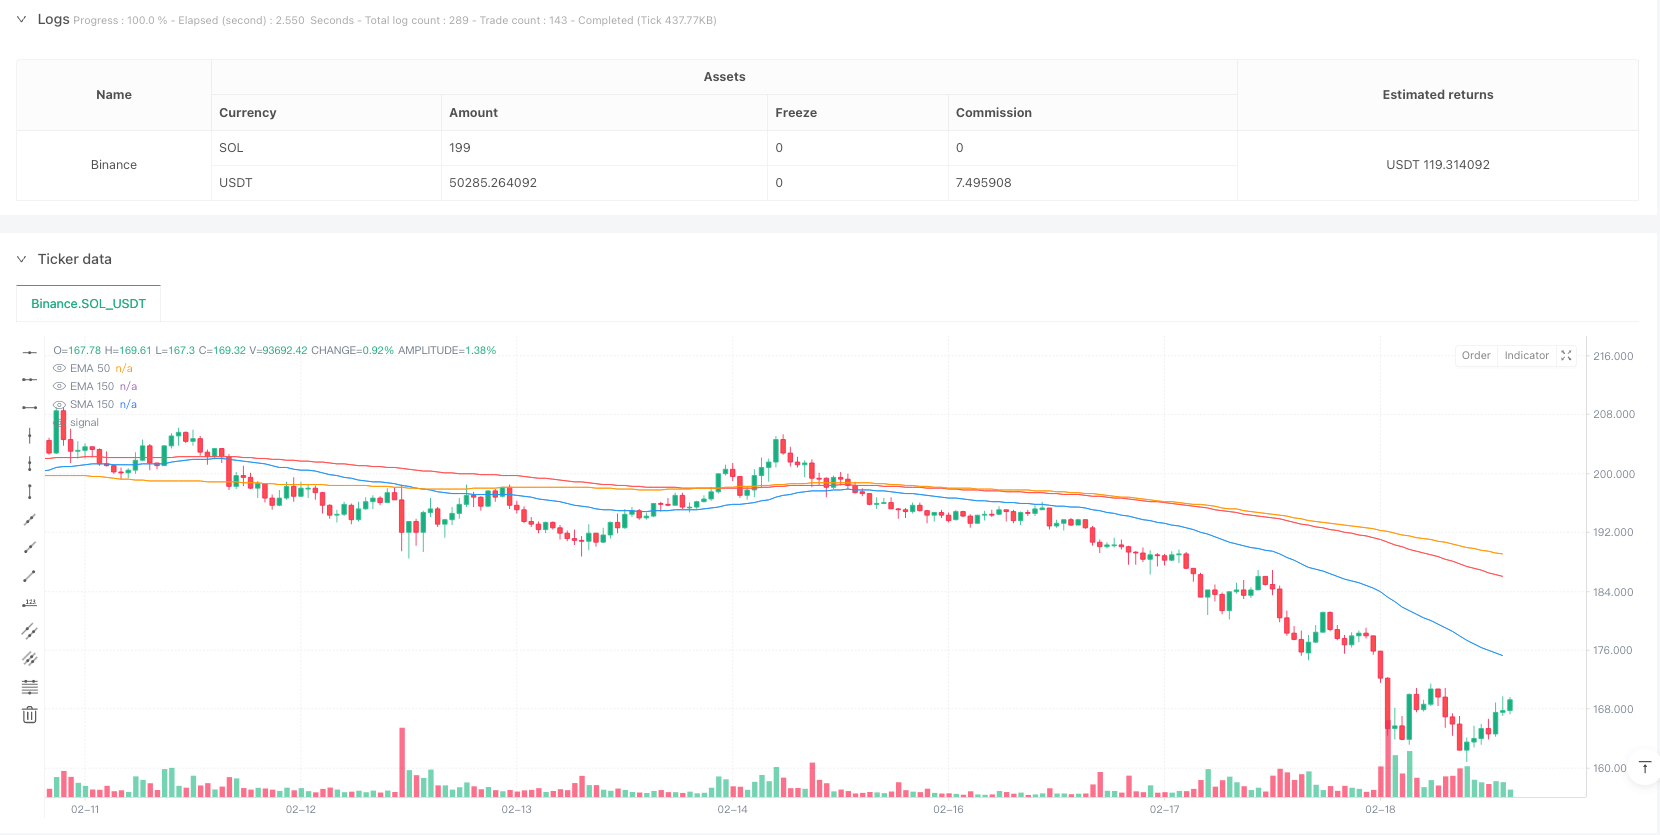
개요
이 전략은 지수 이동 평균 (EMA) 과 간단한 이동 평균 (SMA) 을 결합한 트렌드 추적 거래 시스템이다. 이 전략은 주로 EMA50와 EMA150의 교차를 사용하여 거래 신호를 생성하며, SMA150을 중지 라인으로 사용하고, 중단 후 재입장 메커니즘을 포함합니다. 이 디자인은 중장기 트렌드를 포착하는 동시에 위험을 효과적으로 제어 할 수 있습니다.
전략 원칙
전략의 핵심 논리에는 다음과 같은 핵심 요소가 포함됩니다.
- 입구 신호: EMA50이 EMA150을 위쪽으로 통과하면 다중 신호가 발생하고, EMA50이 EMA150을 아래로 통과하면 공백 신호가 발생한다.
- 스톱로스 메커니즘: 가격이 SMA150 아래로 떨어질 때 스톱로스 평지 포지션을 트리거한다.
- 재입장 메커니즘: 스톱로스를 터치한 후, 가격이 EMA150을 다시 돌파하면 재입장하고, EMA50이 EMA150을 다시 돌파하면 진입이 비워진다.
- 거래 실행: 전략은 0.1%의 수수료와 3 점의 슬라이드 포인트를 고려하여 지정된 시간 범위 내에서 거래를 수행합니다.
전략적 이점
- 트렌드 추적 능력: 다양한 주기의 평균선 조합을 사용하여 시장의 트렌드를 효과적으로 포착할 수 있다.
- 리스크 관리가 완벽합니다: 명확한 스톱 로즈 조건을 설정하여 과도한 손실을 방지합니다.
- 재입장 메커니즘의 유연성: 시장 조건이 개선될 때 재입장을 허용하여 수익을 올릴 수 있다.
- 파라미터 설정은 합리적입니다: EMA50와 EMA150의 주기 선택은 민감성과 안정성을 균형 잡는다.
- 실제 거래 비용을 고려하십시오: 수수료와 슬라이드 요소를 포함하여 실제 거래 환경에 더 가깝습니다.
전략적 위험
- 변동 시장 위험: 변동 시장에서는 종종 가짜 브레이크 신호가 발생할 수 있습니다.
- 지연 위험: 이동 평균 지표 자체는 지연성이 있으며, 최적의 진입 시점을 놓칠 수 있다.
- 재입장 위험: 급격히 변동하는 시장에서 재입장 메커니즘은 연속적인 손실을 초래할 수 있다.
- 자금 관리 위험: 전략에는 특정 위치 관리 프로그램이 포함되어 있지 않습니다.
- 시장 환경 의존성: 전략은 다른 시장 주기에서 큰 차이가 있을 수 있다.
전략 최적화 방향
- 변동률 지표를 도입: ATR 또는 볼린저 밴드를 추가하여 스톱 포지션을 조정하여 스톱을 더 적응시킬 수 있습니다.
- 포지션 관리를 개선: 변동률 기반의 동적 포지션 관리 시스템을 추가하는 것이 좋습니다.
- 최적화된 재입장 조건: RSI와 같은 흔들림 지표와 결합하여 재입장 신호의 정확도를 높일 수 있다.
- 시장 환경 필터링을 늘리십시오: 트렌드 강도 지표를 추가하고 낮은 트렌드 시장에서 거래 빈도를 줄이십시오.
- 자기 적응 파라미터를 개발: 시장의 변동에 따라 수평선 주기를 동적으로 조정할 수 있다.
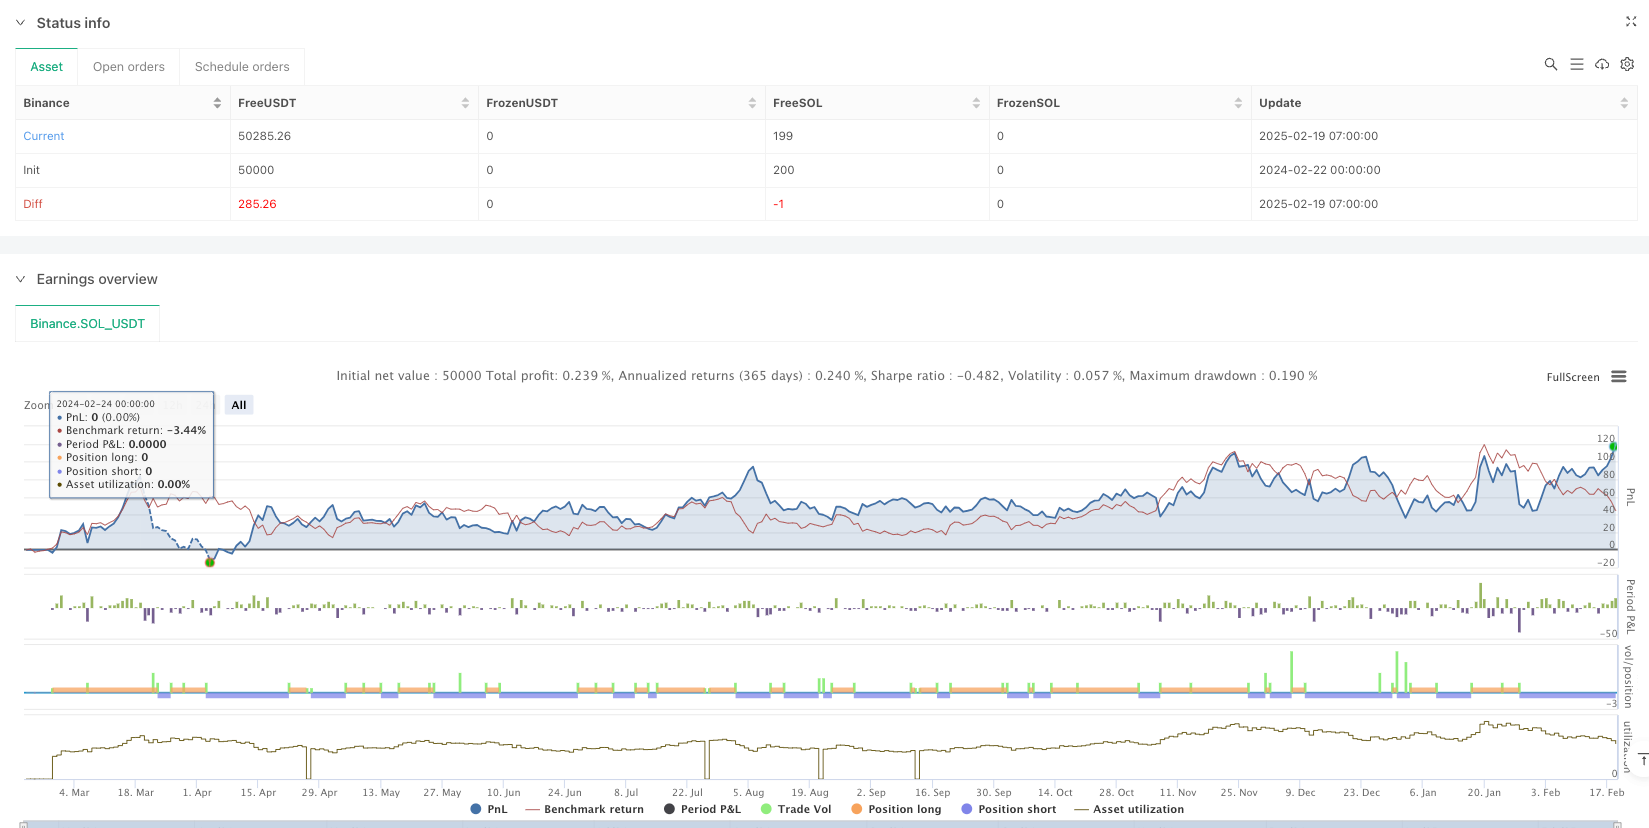
요약하다
이것은 합리적으로 설계된 트렌드 추적 전략으로, 평선 교차로 트렌드를 포착하고, 완벽한 위험 제어 장치가 장착되어 있다. 전략의 주요 장점은 시스템의 트렌드 추적 능력과 위험 관리 설계에 있다. 그러나 실제 적용에서는 전략의 성능에 대한 시장 환경의 영향을 주의해야 한다. 제안된 최적화 방향에 의해 전략은 더 향상될 여지가 있다.
전략 소스 코드
/*backtest
start: 2024-02-22 00:00:00
end: 2025-02-19 08:00:00
period: 1h
basePeriod: 1h
exchanges: [{"eid":"Binance","currency":"SOL_USDT"}]
*/

//@version=6
strategy("EMA 50 and EMA 150 with SMA150 Stop-loss and Re-Entry #ganges", overlay=true, commission_type=strategy.commission.percent, commission_value=0.1, slippage=3)


// EMA and SMA Calculations
ema50 = ta.ema(close, 50)
ema150 = ta.ema(close, 150)
sma150 = ta.sma(close, 150)

// Conditions for Buy, Sell, and Stop-Loss
ema50CrossAboveEMA150 = ta.crossover(ema50, ema150)  // Buy signal
ema50CrossBelowEMA150 = ta.crossunder(ema50, ema150) // Sell signal
priceCrossAboveEMA150 = ta.crossover(close, ema150) // Price crosses EMA 150 from below
priceCloseBelowSMA150 = close < sma150              // Stop-loss for long positions


// Track stop-loss hit state
var bool stopLossHit = false

// Strategy Logic
// Buy Logic: EMA 50 crosses EMA 150 from below
if ema50CrossAboveEMA150
    strategy.entry("Buy Signal", strategy.long, qty=1)
    stopLossHit := false // Reset stop-loss state when a new buy position is opened

// Sell Logic: EMA 50 crosses EMA 150 from above
if ema50CrossBelowEMA150
    strategy.entry("Sell Signal", strategy.short, qty=1)
    stopLossHit := false // Reset stop-loss state when a new sell position is opened

// Stop-Loss for Long Positions: Close if price falls below SMA 150
if strategy.position_size > 0 and priceCloseBelowSMA150
    strategy.close("Buy Signal")
    stopLossHit := true // Mark stop-loss hit

// Re-Entry Logic After Stop-Loss
if stopLossHit
    if priceCrossAboveEMA150 // Re-buy logic: PRICE crosses EMA 150 from below
        strategy.entry("Re-Buy Signal", strategy.long, qty=1)
        stopLossHit := false // Reset stop-loss state after re-entry
    if ema50CrossBelowEMA150 // Re-sell logic: EMA 50 crosses EMA 150 from above
        strategy.entry("Re-Sell Signal", strategy.short, qty=1)
        stopLossHit := false // Reset stop-loss state after re-entry

// Plot EMA and SMA Lines
plot(ema50, color=color.blue, title="EMA 50")
plot(ema150, color=color.red, title="EMA 150")
plot(sma150, color=color.orange, title="SMA 150")


// // Calculate Recent All-Time High
// highestHigh = ta.highest(high, 500) // Lookback period of 500 bars
// percentageFall = ((highestHigh - close) / highestHigh) * 100

// // Display Percentage Fall on the Most Recent Candle Only
// isLastBar = bar_index == ta.max(bar_index)
// if isLastBar
//     labelText = str.tostring(percentageFall, "#.##") + "% Fall from ATH"
//     labelPosition = high + ta.atr(14) * 2 // Positioning label above the candle
//     label.new(bar_index, labelPosition, labelText, color=color.red, textcolor=color.white, size=size.small, style=label.style_label_down)