
2
Follow
478
Followers
개요
이 전략은 RSI (상대적으로 약한 지표) 와 트렌드 평균선을 결합한 이중 필터링 거래 시스템이다. 이 전략은 RSI의 오버 바이 오버 소드 신호와 장기 트렌드 평균선을 결합하여 일선 수준에서 거래한다. 전략의 핵심은 거래의 정확성과 신뢰성을 높이기 위해 전통적인 RSI 거래 신호의 기초에 트렌드 필터를 추가하는 것이다.
전략 원칙
이 전략은 다음과 같은 핵심 구성 요소에 기반합니다.
- RSI 지표는 14주기를 기본으로 초과 구매 및 초과 판매 지역을 식별합니다.
- 초고가 70위, 초고가 30위
- 200주기 간단한 이동 평균을 트렌드 필터로 사용함
- 구매 조건: RSI가 오버셀 영역에서 상향으로 돌파되고 가격이 평균선 위에 있습니다.
- 판매 조건: RSI가 오버 바이 영역에서 아래로 돌파되고 가격이 평균선 아래에 있습니다.
전략은 각 신호가 발생했을 때 자동으로 거래를 실행하고, 상기 기능도 구성할 수 있다.
전략적 이점
- 이중 확인 메커니즘은 거래의 신뢰성을 크게 향상시킵니다.
- 트렌드 및 동력 지표와 결합하여 잘못된 신호의 위험을 줄입니다.
- 완전히 자동화된 거래 실행 시스템
- 유연한 변수 설정으로 정책 최적화
- 실시간 경고 기능이 통합되어 실제 작업이 가능합니다.
- 시각 인터페이스는 거래 신호를 명확하게 표시합니다.
- 전략 검증을 위한 리포트 기능을 지원합니다
전략적 위험
- 시장의 흔들림으로 인해 거래 신호가 자주 발생할 수 있습니다.
- 트렌드 전환점이 지연될 수 있다
- 잘못된 매개변수 설정은 전략 성능에 영향을 미칠 수 있습니다.
- 시장의 극단적 변동이 큰 회수로 이어질 수 있다.
다음의 방법으로 위험을 관리하는 것이 좋습니다.
- 정지 지점을 합리적으로 설정합니다.
- 포지션 크기를 적절하게 조정합니다.
- 규칙적으로 최적화 정책 변수
- 다른 기술 지표와 결합하여 판단을 돕습니다.
전략 최적화 방향
- 변동율 필터를 추가하여 높은 변동율 동안 거래 기준을 조정합니다.
- 시장 상황에 따라 동적으로 변수를 조정하는 적응 변수 메커니즘을 도입
- 볼륨 확인 메커니즘을 추가하여 신호 안정성 향상
- 더 복잡한 출전 메커니즘을 개발하여 시한부 수익을 최적화합니다.
- 다중 시간 주기의 분석을 통합하여 더 포괄적인 시장 관점을 제공합니다.
요약하다
이 전략은 RSI와 트렌드 일률을 결합하여 안정적인 거래 시스템을 구축한다. 전략은 합리적인 설계, 명확한 운영 규칙, 좋은 실용성을 가지고 있다. 합리적인 위험 관리와 지속적인 최적화를 통해 이 전략은 실제 거래에서 안정적인 수익을 올릴 것으로 보인다.
Source
Pine
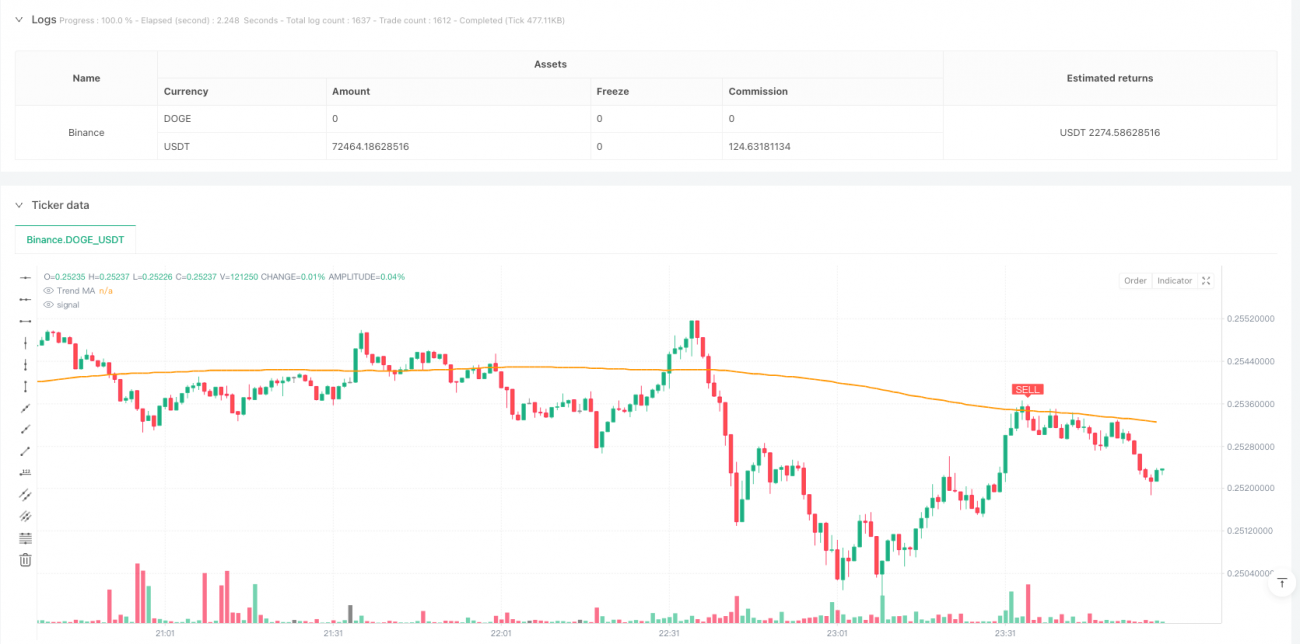
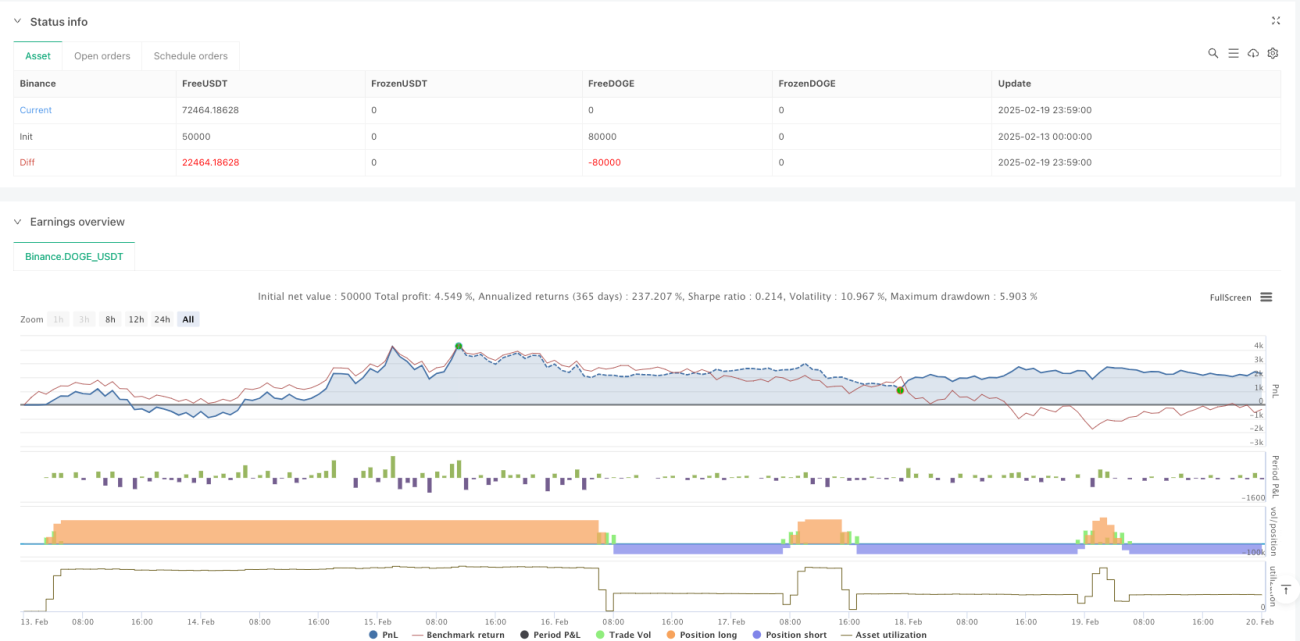
/*backtest
start: 2025-02-13 00:00:00
end: 2025-02-20 00:00:00
period: 1m
basePeriod: 1m
exchanges: [{"eid":"Binance","currency":"DOGE_USDT"}]
*/

//@version=5
strategy("Leading Indicator Strategy – Daily Signals", overlay=true,
     pyramiding=1, initial_capital=100000,
default_qty_type=strategy.percent_of_equity, default_qty_value=100)Strategy parameters
Related strategies
Comment
All comments (0)
No data
- 1