
2
Follow
478
Followers
개요
이 전략은 양자 정밀성과 다중 기술 지표가 결합된 거래 시스템으로, 다층의 트렌드 확인과 위험 관리를 통해 안정적인 거래를 실현합니다. 전략은 동력 지표, 변동률 분석, 트렌드 강도 및 시장 감정과 같은 다차원 분석을 통합하여 전체적인 거래 의사 결정 시스템을 형성합니다.
전략 원칙
이 전략은 다단계 거래 신호 확인 메커니즘을 사용합니다.
- ATR을 이용한 동적 스톱로스 및 수익 설정
- 동력 지표, 변동률 및 트렌드 강도 3번 검증으로 확인 신호를 설정합니다.
- 10과 30주기 EMA 교차점에서의 거래
- 신경 적응 트렌드 라인과 AI 시장 감정 지표와 결합하여 트렌드 추적
- 3:1의 리스크/이익 비율을 설정하여 자금 관리를 최적화하십시오.
전략적 이점
- 다차원 신호 검증 시스템은 가짜 침입의 위험을 크게 줄였습니다.
- 동적 중지 손실 설정은 다른 시장 환경에 적응
- 신경 적응 트렌드 라인은 트렌드 방향을 더 정확하게 판단합니다.
- AI 시장 감정 지표가 시장 통찰력을 강화합니다.
- 좋은 리스크 관리 시스템으로 자금의 안전성을 보장합니다.
- 전략 논리는 명확하고 유지 관리 및 최적화가 쉽습니다.
전략적 위험
- 복수확인 메커니즘으로 인해 입국 신호가 지연될 수 있습니다.
- 높은 변동성 시장에서 빈번한 손실을 유발할 수 있습니다.
- 시장이 변할 때 동적 상쇄 손실이 충분히 빠르지 않을 수 있습니다.
- 더 큰 샘플 데이터가 필요하여 변수를 최적화합니다.
- 계산 복잡성이 높기 때문에 실행 효율에 영향을 미칠 수 있습니다.
전략 최적화 방향
- 시장 상태에 따라 지수 변수를 동적으로 조정하는 적응 변수 최적화 시스템을 도입합니다.
- 시장 변동율 필터를 추가하여 극한 시장 환경에서 자동으로 위치를 조정합니다.
- 확인 신호 생성 논리를 최적화하고 신호 지연을 줄인다.
- 시장 정서 지표를 최적화하기 위한 기계 학습 알고리즘 도입
- 거래비용을 늘리고 거래 빈도를 최적화한다
요약하다
이것은 전통적인 기술 분석과 현대적인 양적 방법을 결합한 완전한 거래 시스템이다. 다층의 신호 확인과 위험 관리를 통해, 전략은 안정성을 보장하면서도 잘 적응한다. 약간의 최적화 공간이 있지만, 전체적인 프레임워크는 합리적으로 설계되어 장기적인 실장 운영에 적합하다. 지속적인 최적화와 개선으로, 이 전략은 다양한 시장 환경에서 안정적인 성능을 유지할 수 있을 것으로 보인다.
Source
Pine
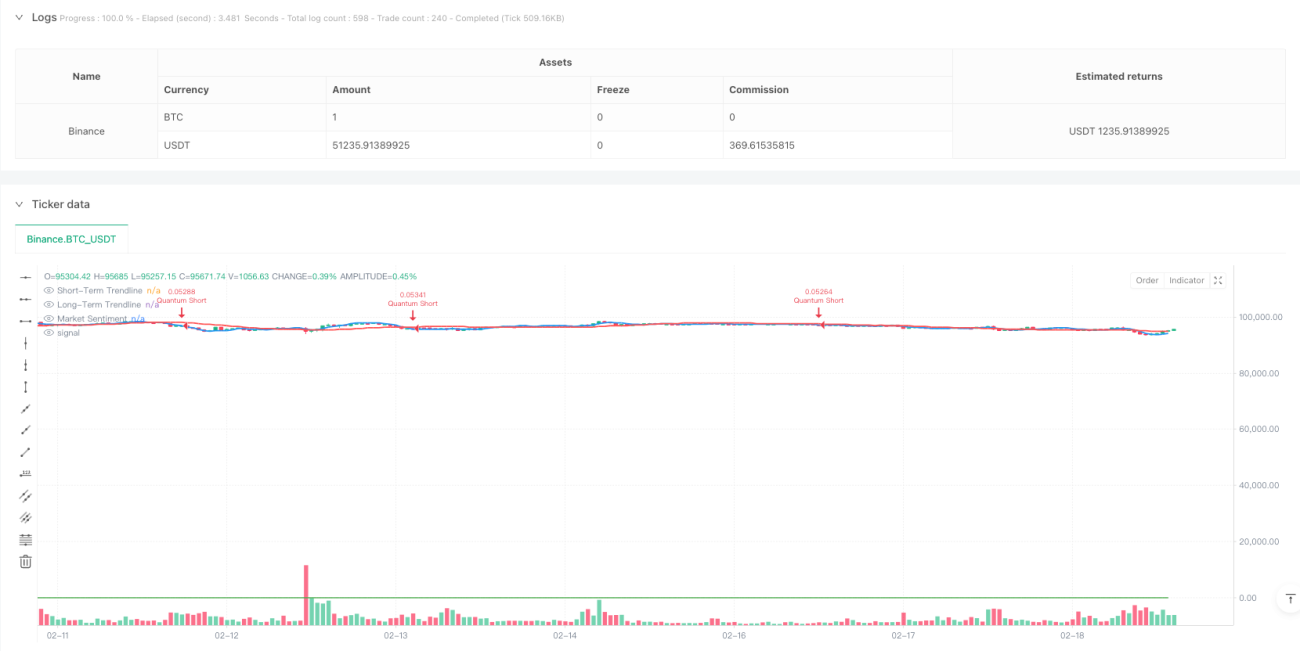
/*backtest
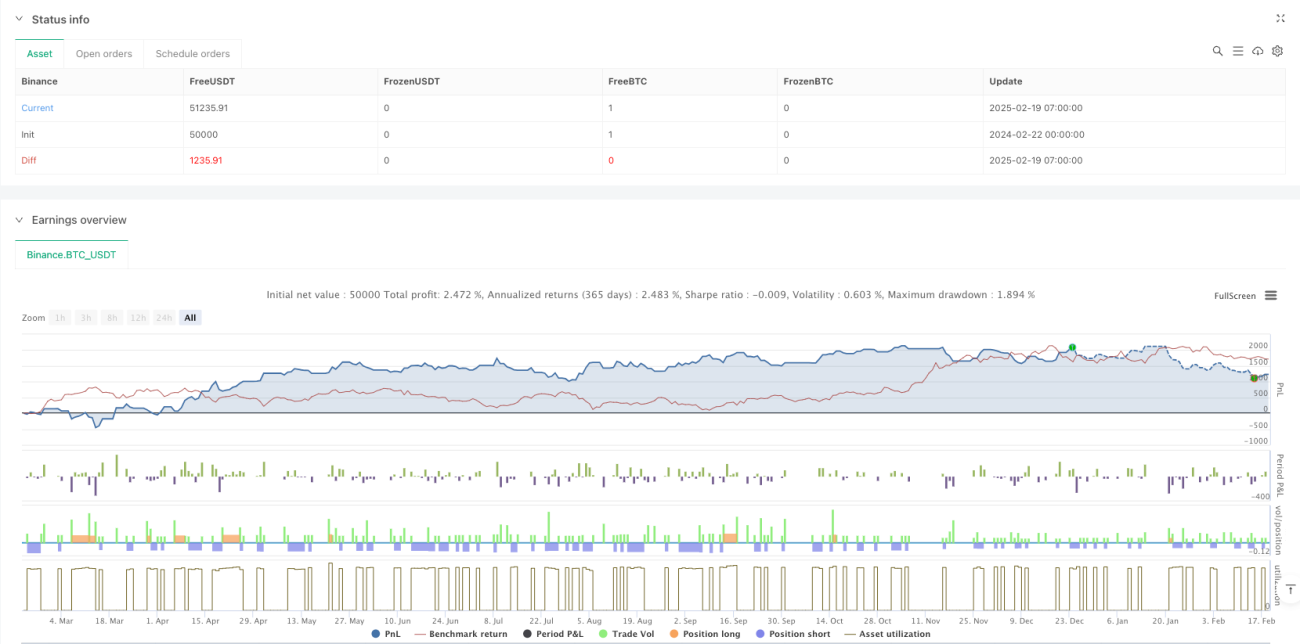
start: 2024-02-22 00:00:00
end: 2025-02-19 08:00:00
period: 1h
basePeriod: 1h
exchanges: [{"eid":"Binance","currency":"BTC_USDT"}]
*/
//@version=5
strategy("Quantum Precision Forex Strategy", overlay=true, default_qty_type=strategy.percent_of_equity, default_qty_value=10)
// Input parametersStrategy parameters
Related strategies
Comment
All comments (0)
No data
- 1