
개요
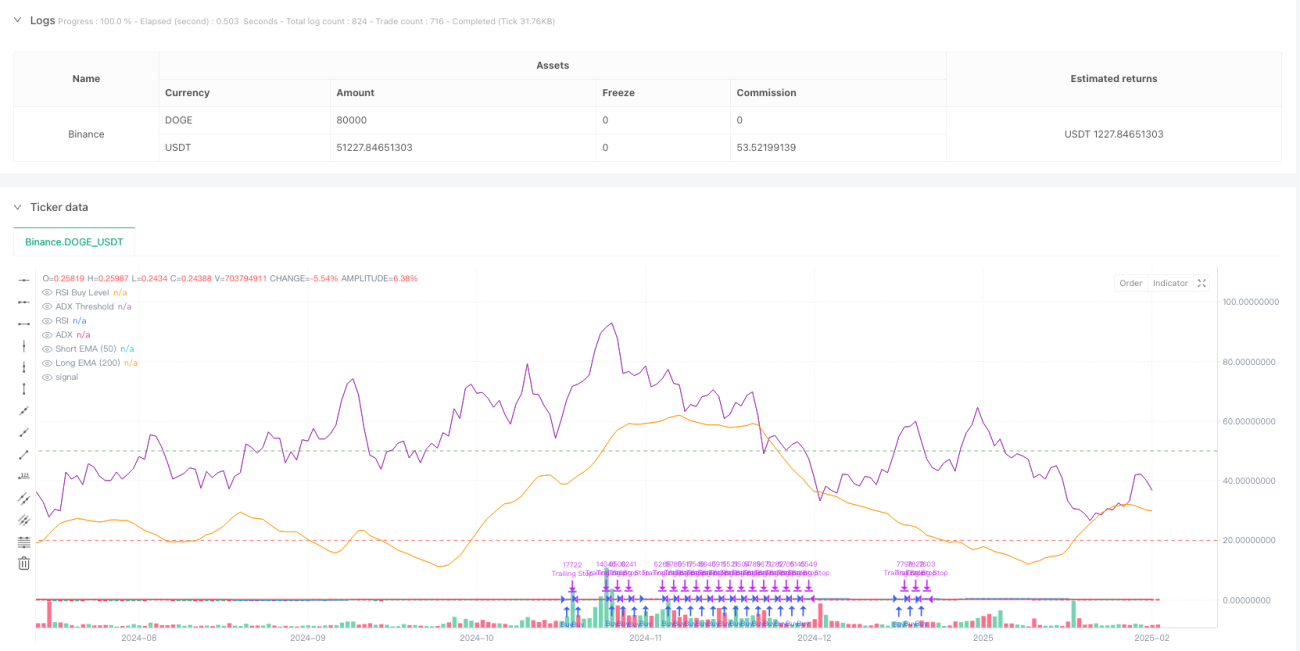
이 전략은 다중 이동 평균, 동적 지표 및 동적 위험 제어를 결합한 트렌드 추적 시스템이다. 전략은 가격 추세, 시장 운동 및 변동률을 분석하여 거래 기회를 식별하고, 엄격한 포지션 관리 및 스톱 메커니즘을 사용하여 위험을 제어한다. 핵심 논리는 장기 단기 지수 이동 평균 (EMA) 의 교차와 상대적으로 강한 약한 지수 (RSI) 의 조합을 중심으로하며, 평균 실제 파동 (ATR) 을 통해 스톱 포지션을 동적으로 조정한다.
전략 원칙
이 전략은 거래 신호를 확인하기 위해 다단계 인증 메커니즘을 사용합니다.
- 추세 확인: 50일과 200일 두 개의 지수 이동 평균을 사용하여 중장기 추세를 판단하고, 단기 평균선이 장기 평균선 위에 10주 이상 지속되는 것을 요구한다.
- 동력 검증: RSI 지표를 사용하여 가격 동력을 검증하고, RSI 값이 설정된 하위값 (기본 50) 보다 크면 상승 동력을 확인한다.
- 트렌드 강도: 평균 트렌드 지수 ((ADX) 를 도입하여 트렌드 강도를 측정합니다. ADX가 20보다 크면 트렌드가 뚜렷하다는 것을 나타냅니다.
- 동적 위험 제어: ATR을 기반으로 설계된 동적 중지, 중지 거리는 ATR의 2.5배이며, 동시에 추적 중지 장치를 설정한다.
- 지능형 포지션 관리: 계좌의 적당권과 미리 설정된 위험 비율에 따라 ATR 동적과 결합하여 포지션 개설 수를 계산한다.
전략적 이점
- 다중 신호 검증: 평균선, 동력 및 트렌드 강도 등의 여러 차원의 지표 검증을 통해 신호 신뢰도를 높인다.
- 동적 위험 관리: 변동률에 기반한 동적 중지 및 추적 중지를 사용하여 시장 상황에 따라 조정할 수 있습니다.
- 스마트 포지션 제어: 계좌 규모와 시장 변동률에 따라 포지션을 동적으로 조정하여 단일 거래 위험을 효과적으로 제어합니다.
- 트렌드 지속성 요구 사항: 트렌드 지속 시간 요구 사항을 설정하여 가짜 돌파구를 피하십시오.
- 체계화된 거래 경고: 거래 신호 상기 기능이 통합되어 실시간으로 작동하기 쉽다.
전략적 위험
- 트렌드 리버스 위험: 강한 트렌드가 끝나면 큰 회전이 발생할 수 있으며, 시장의 거시적인 측면과 함께 조정하는 것이 좋습니다.
- 흔들림 시장의 성과: 가로판 흔들림 시장에서 거래가 빈번하게 발생하여 거래 비용이 증가할 수 있다.
- 매개 변수 민감성: 여러 지표 매개 변수의 설정은 전략 성능에 영향을 미치며, 피드백을 통해 최적화해야 한다.
- 슬라이드 포인트 영향: 시장 유동성이 부족할 때 큰 슬라이드 포인트에 직면하여 전략 수익에 영향을 줄 수 있습니다.
전략 최적화 방향
- 시장 환경 적응: 다양한 시장 환경에서의 적응력을 높이기 위해 전략 매개 변수를 동적으로 조정하기 위해 변동률 지표 (VIX와 같은) 를 도입 할 수 있습니다.
- 신호 필터링: 신호 품질을 높이기 위해 거래량 지표 검증을 추가하는 것을 고려하십시오.
- 정지 메커니즘: 시장의 변동에 따라 동적 정지 메커니즘을 설계하여 수익 회수율을 최적화 할 수 있습니다.
- 시간주기 최적화: 다른 시간주기에 대한 신호 일관성을 검증하는 것을 고려하여 거래 안정성을 높인다.
- 기계 학습 최적화: 전략 적응성을 높이기 위해 기계 학습 알고리즘의 동적 최적화 매개 변수를 도입할 수 있다.
요약하다
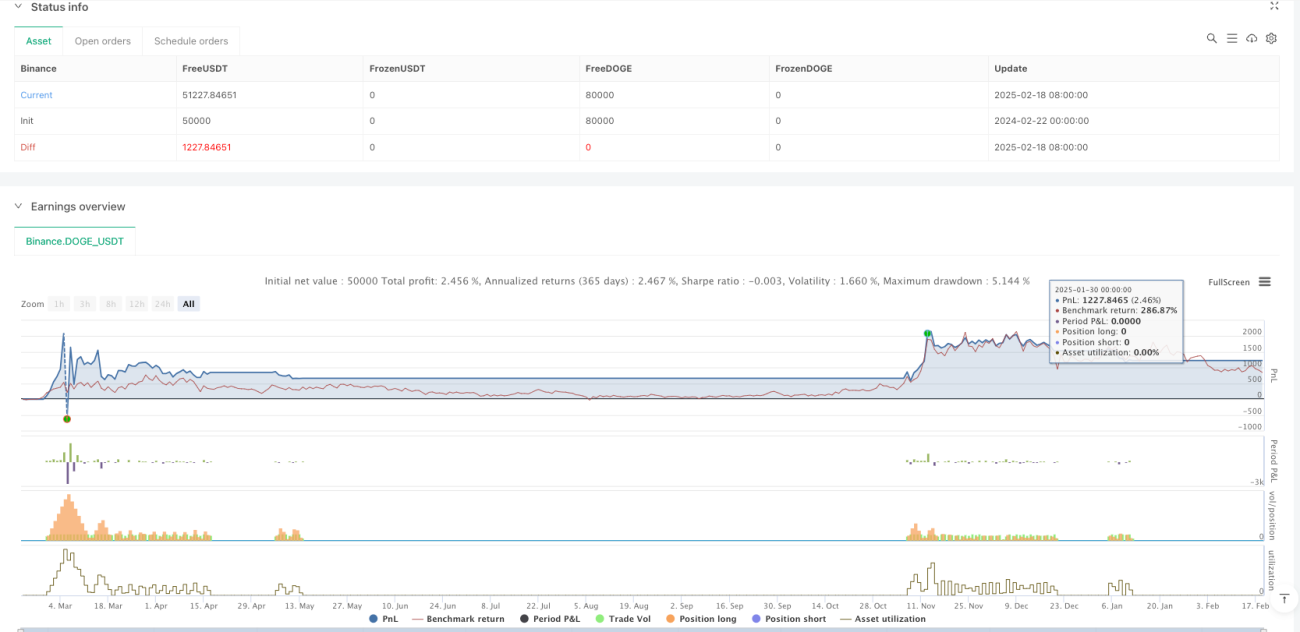
이 전략은 다중 기술 지표의 통합적인 사용을 통해 완전한 트렌드 추적 거래 시스템을 구축한다. 전략은 위험 통제에서 우수한 성능을 발휘하며, 동적 스톱로스 및 포지션 관리로 효과적으로 회수한다. 전략은 확장성이 강하며, 여러 가지 최적화 방향을 예약한다. 거래자는 실장에서 사용할 때 특정 시장 특성과 자신의 위험 선호도에 따라 매개 변수를 조정하는 것이 좋습니다.
Overview
This strategy is a trend following system that combines multiple moving averages, momentum indicators, and dynamic risk control. It identifies trading opportunities by analyzing price trends, market momentum, and volatility while implementing strict position management and stop-loss mechanisms. The core logic revolves around the crossover of long and short-term exponential moving averages (EMA) combined with the Relative Strength Index (RSI), using Average True Range (ATR) for dynamic stop-loss positioning.
Strategy Principles
The strategy employs a multi-layer verification mechanism to confirm trading signals:
- Trend Confirmation: Uses 50-day and 200-day EMAs to judge medium and long-term trends, requiring the short-term average to remain above the long-term average for more than 10 periods.
- Momentum Verification: Uses RSI to verify price momentum, confirming upward momentum when RSI exceeds the set threshold (default 50).
- Trend Strength: Incorporates Average Directional Index (ADX) to measure trend strength, with ADX above 20 indicating significant trend.
- Dynamic Risk Control: Designs dynamic stop-loss based on ATR, with stop-loss distance set at 2.5 times ATR, including trailing stop mechanism.
- Intelligent Position Management: Dynamically calculates position size based on account equity and preset risk ratio in combination with ATR.
Strategy Advantages
- Multiple Signal Verification: Improves signal reliability through validation across multiple dimensions including moving averages, momentum, and trend strength.
- Dynamic Risk Management: Employs volatility-based dynamic and trailing stops that adapt to market conditions.
- Intelligent Position Control: Dynamically adjusts positions based on account size and market volatility, effectively controlling single trade risk.
- Trend Persistence Requirement: Avoids false breakouts by setting trend duration requirements.
- Systematic Trading Alerts: Integrates trading signal notifications for real-time operation.
Strategy Risks
- Trend Reversal Risk: May experience significant drawdowns at trend endings, suggesting adjustment based on macro market conditions.
- Sideways Market Performance: May generate frequent trades in range-bound markets, increasing transaction costs.
- Parameter Sensitivity: Strategy performance affected by multiple indicator parameters, requiring backtest optimization.
- Slippage Impact: May face significant slippage in low liquidity conditions, affecting strategy returns.
Optimization Directions
- Market Environment Adaptation: Consider introducing volatility indicators (like VIX) for dynamic parameter adjustment to improve adaptability across different market conditions.
- Signal Filtering: Consider adding volume indicator verification to improve signal quality.
- Profit-Taking Mechanism: Design dynamic profit-taking mechanisms based on market volatility to optimize return-to-drawdown ratio.
- Timeframe Optimization: Consider validating signal consistency across different timeframes to improve trading stability.
- Machine Learning Optimization: Consider introducing machine learning algorithms for dynamic parameter optimization to enhance strategy adaptability.
Summary
This strategy constructs a complete trend following trading system through the comprehensive use of multiple technical indicators. It shows excellent performance in risk control through dynamic stop-loss and position management. The strategy demonstrates strong extensibility with multiple optimization directions reserved. Traders are advised to adjust parameters according to specific market characteristics and their own risk preferences when implementing in live trading.
- 1