
2
Follow
478
Followers
개요
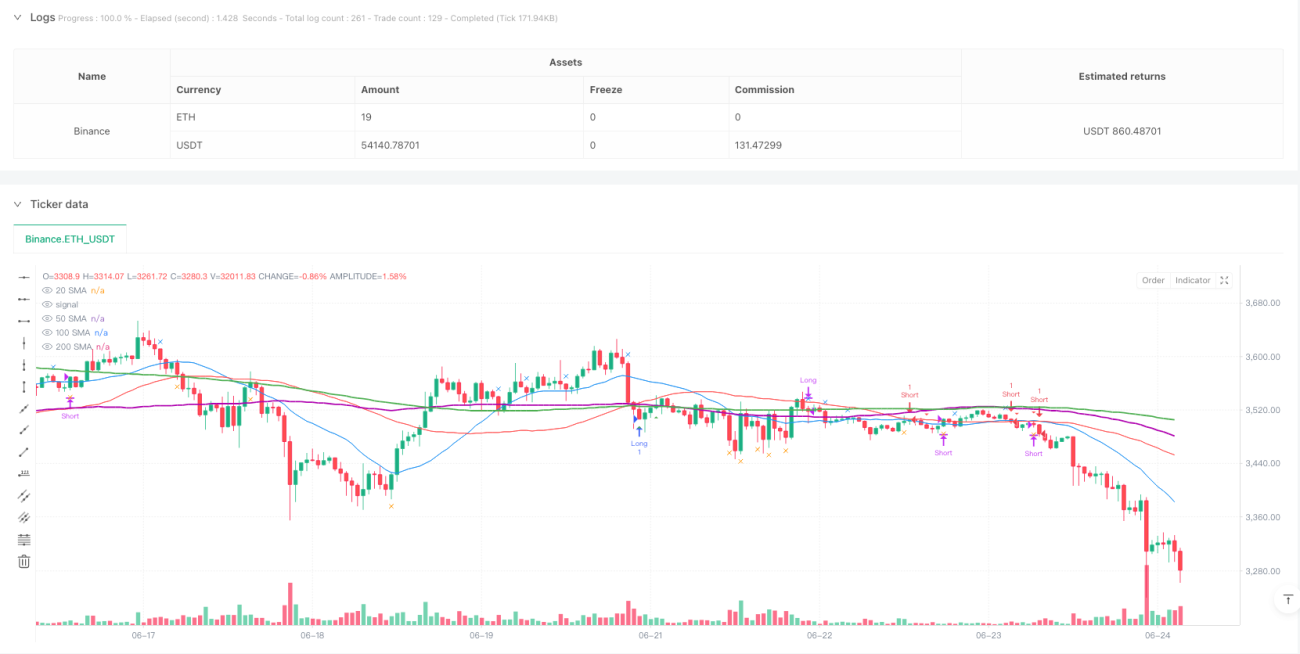
이 전략은 여러 층의 이동 평균 ((SMA) 에 기반한 트렌드 추적 시스템으로, 정밀한 분기 크로스 검출 기술을 결합한다. 20, 50, 100, 200 주기의 이동 평균의 계층적 관계를 통해 시장의 추세를 결정하고, 실시간 가격과 이동 평균의 크로스 를 사용하여 거래 신호를 유발한다. 전략은 다른 시간대와 거래 시간의 보편성을 충분히 고려하여 설계되었으며, 다양한 시간 주기의 차트에서 작동할 수 있다.
전략 원칙
이 전략은 3층의 트렌드 필터링 메커니즘을 사용하며, 50주기 평균선이 100주기 평균선 위에 있고, 100주기 평균선이 200주기 평균선 위에 있을 때만 상승세를 확인하고, 반대로 하향세를 확인한다. 입력 신호는 50주기 평균선과 가격의 교차에 기초하여, 분기 데이터를 사용하여 정확한 교차 검사를 수행하고, 현재 가격 행동과 전 K선의 위치 관계를 비교하여 교차가 발생하는 시기를 결정한다. 출력 신호는 20주기 평균선과 가격의 관계에 의해 결정되며, 가격이 20주기 평균선 시간선을 돌파했을 때 평소 포지 신호를 유발한다.
전략적 이점
- 정밀한 크로스 검출 메커니즘이 거래 시점의 정확성을 향상시킵니다.
- 다층 이동 평균의 트렌드 확인 방법은 가짜 신호를 효과적으로 필터링할 수 있습니다.
- 이 전략은 세계 어느 시장에서나 사용할 수 있는 좋은 시간대 적응력을 가지고 있습니다.
- 입출력 논리는 통합되고 명확하며 이해하기 쉽고 실행이 가능합니다.
- 여러 시기를 적용할 수 있는 그래프, 강력한 보편성
전략적 위험
- 불안한 시장에서 빈번한 잘못된 신호가 발생하여 과다 거래가 발생할 수 있습니다.
- 이동 평균은 그 자체로 지연되어 있으며 중요한 전환점을 놓칠 수 있습니다.
- 빠르게 변동하는 시장에서, 분단 크로스 검사는 과도한 신호를 생성할 수 있습니다.
- 여러 층의 트렌드 필터링으로 잠재적인 거래 기회를 놓칠 수 있습니다.
- 고정 출전 조건은 급격한 변동이 있을 때 더 큰 철회로 이어질 수 있다.
전략 최적화 방향
- 동적으로 출구 조건을 조정하기 위해 변동성 지표를 도입하여 시장 환경에 대한 전략의 적응성을 향상시킵니다.
- 거래량 확인 메커니즘을 늘리고 교차 신호의 신뢰성을 높여라
- 역동적인 손해 방지 장치를 설계하여 위험을 더 잘 통제합니다.
- 시장 구조 분석을 추가하여 트렌드 판단의 정확성을 최적화합니다.
- 전략의 안정성을 높이기 위해 적응 가능한 변수 최적화 메커니즘 개발
요약하다
이것은 구조가 완전하고, 논리가 명확한 트렌드 추적 전략이며, 여러 층의 이동 평균의 조합을 통해 신호의 신뢰성을 보장하고, 트렌드에 대한 효과적인 추적을 구현합니다. 전략의 설계는 실용성과 보편성을 충분히 고려하여 다양한 시장 환경에서 사용하기에 적합합니다. 이 전략은 추가로 최적화 및 개선함으로써 실제 거래에서 더 나은 성능을 얻을 수 있습니다.
Source
Pine
Strategy parameters
Related strategies
Comment
All comments (0)
No data
- 1