
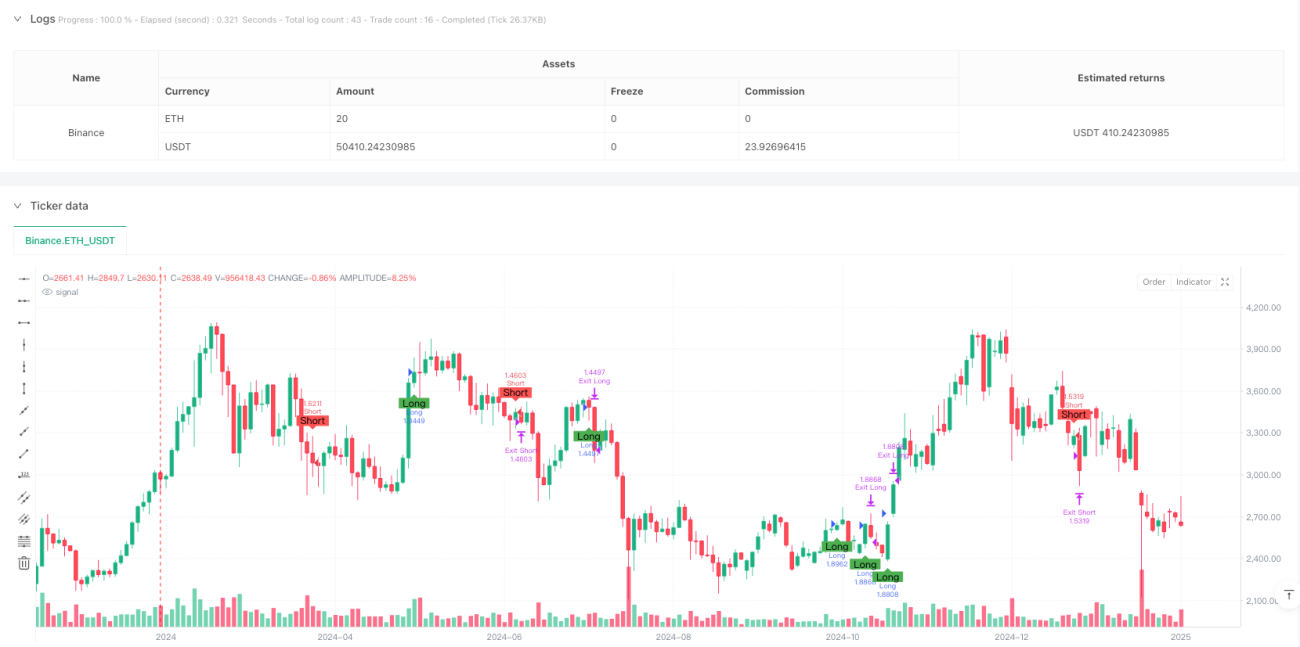
이 전략은 이동 평균 (EMA), 상대적으로 강한 지표 (RSI) 및 이동 평균 동향 분산 (MACD) 의 세 가지 주요 기술 지표를 통합하여 다차원 신호 확인을 통해 시장 동향을 식별하고 동적 스톱 로즈와 함께 위험 관리를 수행합니다. 전략은 완전히 자동화 된 거래 방식을 채택하여 특히 일일 거래에 적합합니다.
이 전략의 핵심 논리는 세 가지의 기술 지표 필터링에 기반합니다.
입력 신호의 생성에는 다음과 같은 조건이 동시에 충족되어야 한다:
전략은 자본의 비율을 보유하는 모드를 채택하고, 매 거래마다 10%의 계정 이자를 사용하며, 2%의 중지 및 1%의 중지 손실과 함께 위험 통제를 수행한다.
위험 관리 제안:
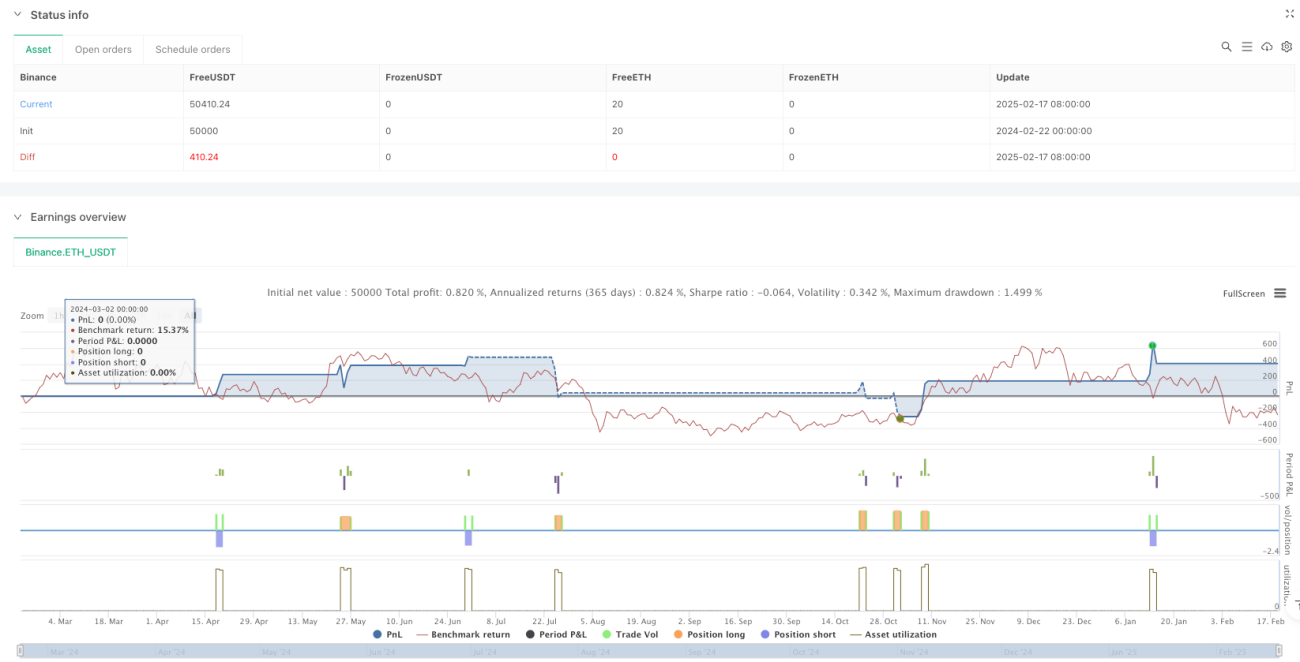
이 전략은 여러 기술 지표의 연동 작용을 통해 비교적 완벽한 트렌드 추적 시스템을 구축한다. 전략의 장점은 신호 신뢰성이 높고, 위험 관리가 완벽하지만, 또한 약간의 뒤처짐과 시장 환경에 대한 의존성이 존재한다. 제안된 최적화 방향을 통해 전략은 그것의 적응성과 안정성을 더욱 향상시킬 수 있다. 실장 응용에서는 충분한 재검토와 매개 변수 최적화를 수행하고, 시장의 실제 상황과 함께 적절한 조정을 수행하는 것이 권장된다.
/*backtest
start: 2024-02-22 00:00:00
end: 2025-02-19 08:00:00
period: 2d
basePeriod: 2d
exchanges: [{"eid":"Binance","currency":"ETH_USDT"}]
*/
// This Pine Script™ code is subject to the terms of the Mozilla Public License 2.0 at https://mozilla.org/MPL/2.0/
// © egidiopalmieri
//@version=5
strategy("BTCUSD Intraday - AI-like Strategy", overlay=true, initial_capital=10000, default_qty_type=strategy.percent_of_equity, default_qty_value=10, commission_type=strategy.commission.percent, commission_value=0.1)
// ==========================
// Risk and Strategy Parameters
// ==========================
takeProfitPerc = input.float(2.0, "Take Profit (%)", step=0.1) / 100.0 // Target profit: 2%
stopLossPerc = input.float(1.0, "Stop Loss (%)", step=0.1) / 100.0 // Stop loss: 1%
// ==========================
// Technical Indicators
// ==========================
emaShortPeriod = input.int(9, "Short EMA (period)", minval=1)
emaLongPeriod = input.int(21, "Long EMA (period)", minval=1)
emaShort = ta.ema(close, emaShortPeriod)
emaLong = ta.ema(close, emaLongPeriod)
// RSI Indicator
rsiPeriod = input.int(14, "RSI (period)", minval=1)
rsiValue = ta.rsi(close, rsiPeriod)
// MACD Indicator
[macdLine, signalLine, _] = ta.macd(close, 12, 26, 9)
// ==========================
// Entry Conditions
// ==========================
// LONG entry: short EMA crosses above long EMA, RSI not in overbought zone, MACD in bullish trend
longCondition = ta.crossover(emaShort, emaLong) and (rsiValue < 70) and (macdLine > signalLine)
// SHORT entry: short EMA crosses below long EMA, RSI not in oversold zone, MACD in bearish trend
shortCondition = ta.crossunder(emaShort, emaLong) and (rsiValue > 30) and (macdLine < signalLine)
// ==========================
// Signal Visualization
// ==========================
plotshape(longCondition, title="Long Signal", location=location.belowbar, color=color.green, style=shape.labelup, text="Long")
plotshape(shortCondition, title="Short Signal", location=location.abovebar, color=color.red, style=shape.labeldown, text="Short")
// ==========================
// Entry Logic
// ==========================
if (longCondition)
strategy.entry("Long", strategy.long)
if (shortCondition)
strategy.entry("Short", strategy.short)
// ==========================
// Stop Loss and Take Profit Management
// The levels are calculated dynamically based on the average entry price
// ==========================
if strategy.position_size > 0
// For long positions
longSL = strategy.position_avg_price * (1 - stopLossPerc)
longTP = strategy.position_avg_price * (1 + takeProfitPerc)
strategy.exit("Exit Long", from_entry="Long", stop=longSL, limit=longTP)
if strategy.position_size < 0
// For short positions
shortSL = strategy.position_avg_price * (1 + stopLossPerc)
shortTP = strategy.position_avg_price * (1 - takeProfitPerc)
strategy.exit("Exit Short", from_entry="Short", stop=shortSL, limit=shortTP)
// ==========================
// Final Notes
// ==========================
// This script uses rules based on technical indicators to generate signals
// "AI-like". The integration of actual AI algorithms is not natively supported in PineScript.
// It is recommended to customize, test, and validate the strategy before using it in live trading.