
2
Follow
478
Followers
개요
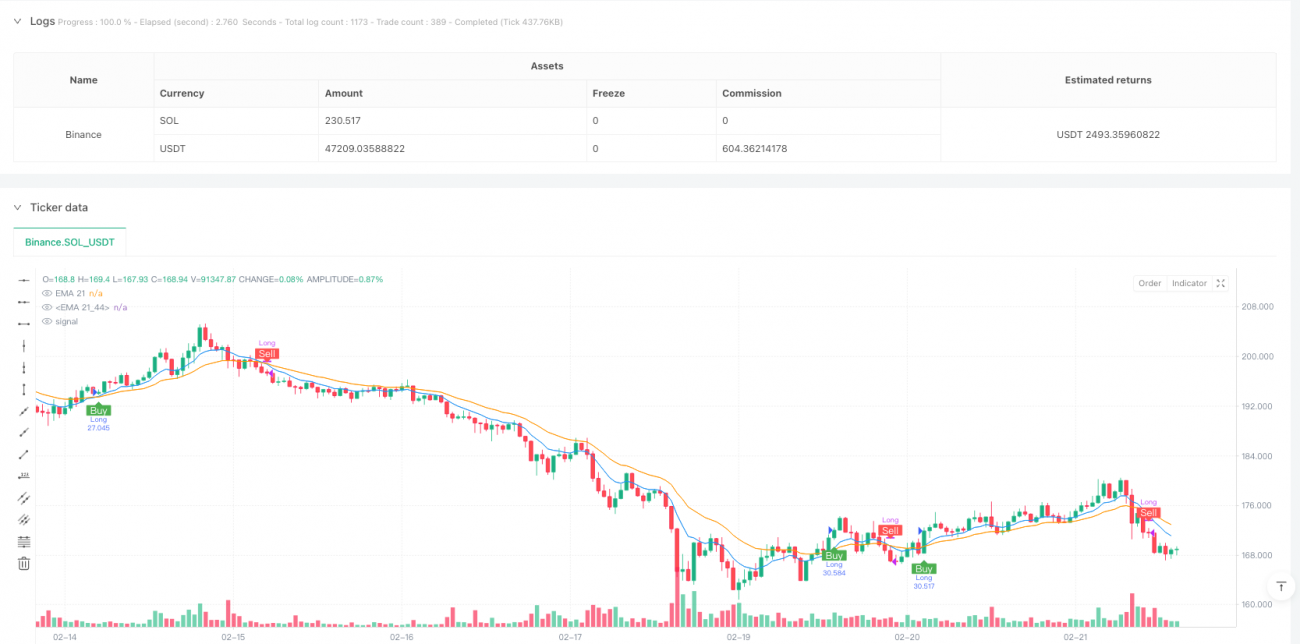
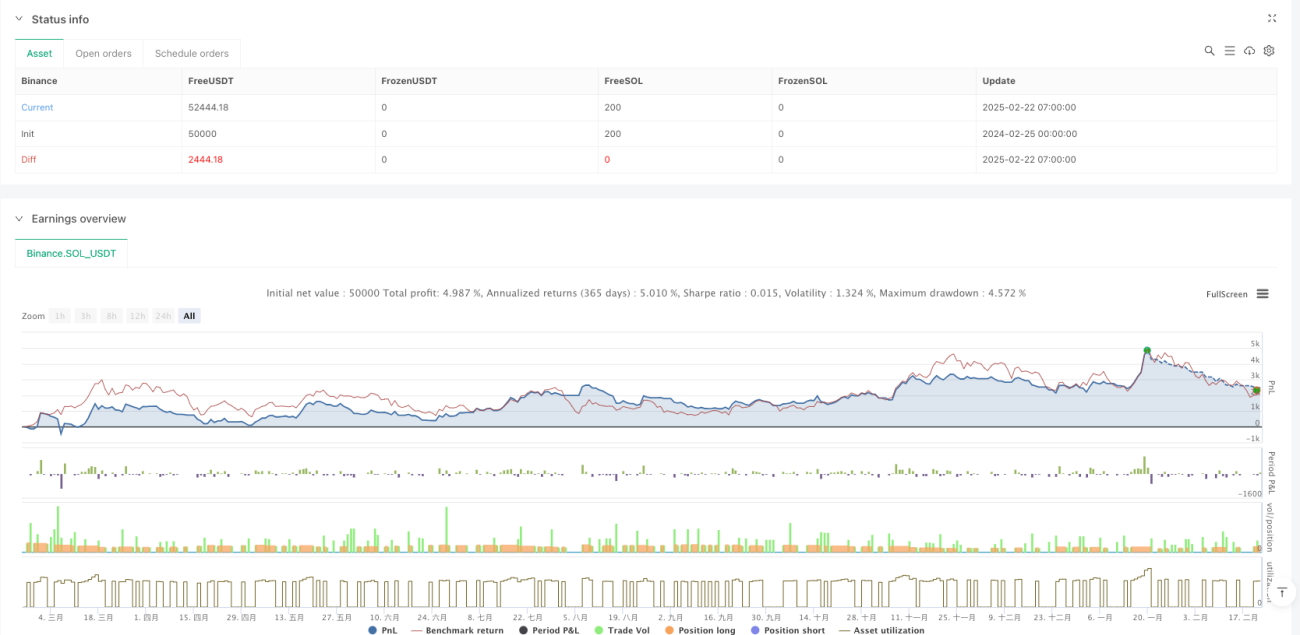
이 전략은 9주기 및 21주기 지수 이동 평균 (EMA) 의 교차 상황을 모니터링하여 거래하는 쌍평선 교차를 기반으로 한 거래 시스템입니다. 전략은 10분 시간 프레임 내에서 작동하며, 포지션을 보유 할 때 포지션을 재개하지 않는 단편 거래 모드를 사용합니다. 시스템은 초기 자본 100,000을 사용하여, 각 거래는 계정 지분의 10%를 사용하여 작동합니다.
전략 원칙
전략의 핵심 원칙은 단기 EMA가 시장 가격 변화에 대한 민감도가 긴 기간 EMA의 특성보다 높다는 것입니다. 단기 EMA ((9주기) 가 상향으로 긴 기간 EMA ((21주기) 를 통과하면 단기 상향이 증가하는 것을 나타냅니다. 시스템이 여러 신호를 냅니다. 단기 EMA가 하향으로 긴 기간 EMA를 통과하면 단기 하향이 증가하는 것을 나타냅니다. 시스템이 평지 신호를 냅니다.
전략적 이점
- 신호 명확성: 거래 신호로 EMA 교차를 사용하여 기준을 객관적으로 명확하게 판단하고 주관적인 간섭을 피한다.
- 위험 관리: 단일 거래 모드를 채택하여 상장 재건으로 인한 위험 중첩을 피합니다.
- 자금 관리: 계정 지분 비율을 사용하여 위치 관리를 하고, 계정 수익과 손실의 동적으로 거래 규모를 조정한다.
- 시각화 지원: 거래자가 직관적으로 판단할 수 있도록 거래 신호 태그와 평행선 이동 차트를 제공합니다.
- 실시간 경고: 거래자가 중요한 거래 기회를 놓치지 않도록 거래 신호 경고 기능이 통합되었습니다.
전략적 위험
- 흔들리는 시장 위험: 가로판 흔들리는 시장에서, 자주 평행선 교차는 여러 개의 가짜 돌파구를 초래할 수 있다.
- 뒤떨어진 위험: EMA는 본질적으로 뒤떨어진 지표이며, 빠른 상황에서 최적의 진입점을 놓칠 수 있다.
- 단일 차원: 평행선 교차에만 의존하는 것은 다른 중요한 시장 정보를 무시할 수 있습니다.
- 고정 주기 위험: 10분 시간 프레임은 모든 시장 환경에 적합하지 않을 수 있습니다.
전략 최적화 방향
- 다차원 검증: 교류량, 변동률 등의 보조 지표를 증가시켜 신호 신뢰도를 높이는 것이 좋습니다.
- 동적 파라미터: EMA 주기를 동적 파라미터로 설정할 수 있으며, 시장의 변동에 따라 자율적으로 조정할 수 있다.
- 포지션 관리: 더 복잡한 포지션 관리 시스템을 도입할 수 있습니다.
- 시장 환경 인식: 시장 환경 인식 모듈을 추가하여 다른 시장 조건에서 다른 거래 매개 변수를 사용합니다.
- 스톱로스 최적화: 동적 스톱로스 메커니즘을 추가하여 위험 관리의 유연성을 높인다.
요약하다
이것은 합리적이고 논리적으로 명확하게 설계된 일직선 교차 전략이다. EMA 교차는 시장의 추세를 포착하고, 단편 거래 모드 및 비율 포지션 관리와 함께, 위험과 수익의 균형을 이룬다. 일부 고유 한 한계가 있음에도 불구하고, 제안된 최적화 방향을 통해 전략의 안정성과 적응력을 더욱 향상시킬 수 있다. 실제 적용에서, 거래자는 특정 시장 특성과 개인 위험 선호에 따라 그에 따른 조정을 할 것을 권장한다.
Source
Pine
/*backtest
start: 2024-02-25 00:00:00
end: 2025-02-22 08:00:00
period: 1h
basePeriod: 1h
exchanges: [{"eid":"Binance","currency":"SOL_USDT"}]
*/

//@version=6
strategy("EMA Crossover Labels (One Trade at a Time)", overlay=true, initial_capital=100000, default_qty_type=strategy.percent_of_equity, default_qty_value=10)

// ==== User Inputs ====Strategy parameters
Related strategies
Comment
All comments (0)
No data
- 1