
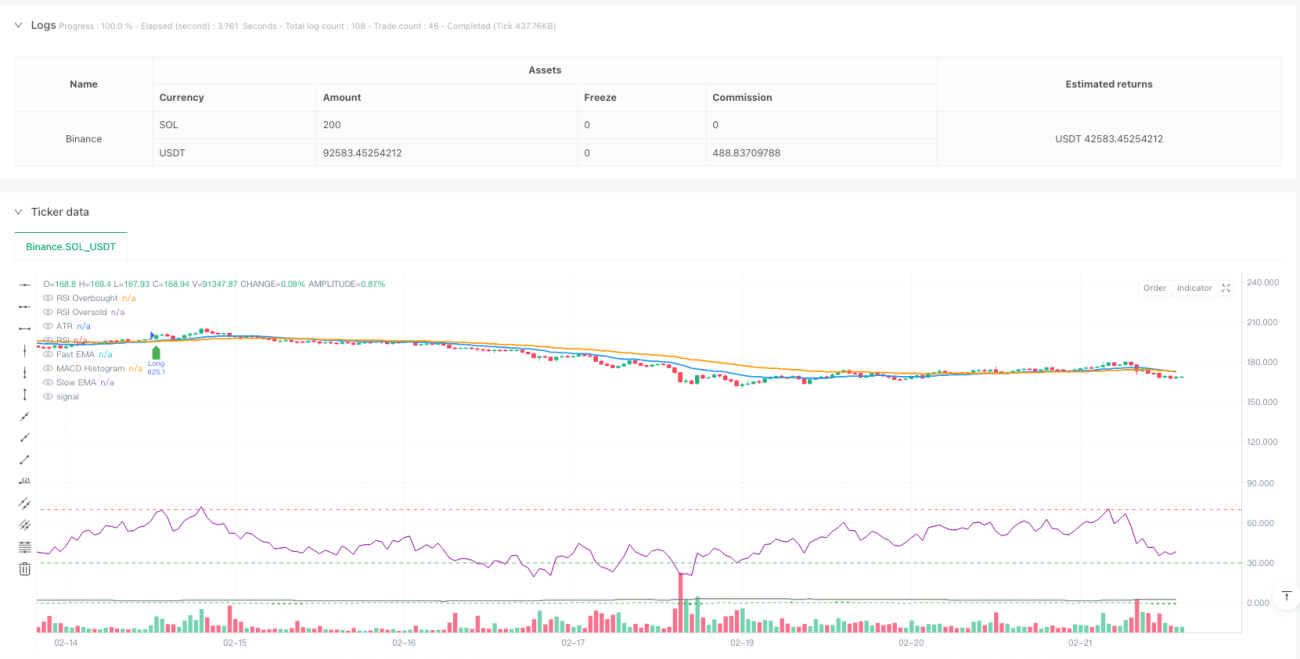
이 전략은 시장의 추세와 동력을 식별하기 위해 다중 기술 지표를 결합한 종합적인 트렌드 추적 거래 시스템이며, 동적 위험 관리 장치를 통합합니다. 전략은 평행선 교차, 상대적으로 약한 지수 ((RSI) 와 이동 평균 동향 분산 (MACD) 의 조화를 통해 거래 신호를 확인하고 실제 파도 폭 지표 ((ATR) 를 사용하여 스톱 로스를 동적으로 조정하여 위험을 자율적으로 관리합니다.
전략의 핵심 논리는 여러 기술 지표의 교차 검증에 기초한다. 첫째, 빠른 지수 이동 평균 ((EMA20) 과 느린 지수 이동 평균 ((EMA50) 의 교차로 잠재적인 트렌드 전환점을 식별한다. 둘째, RSI 지표를 사용하여 가격이 과매매 또는 과매 지역에 있는지 확인하여 극한 지역의 역동성에서 거래를 피한다. 셋째, MACD 지표를 모션 확인 도구로 도입하여 기둥 도표의 부정을 통해 트렌드 동력을 검증한다. 마지막으로, ATR 기반의 동적 상쇄 손실 시스템을 통합하여 시장의 변동성에 따라 자동으로 상쇄 손실 거리를 조정한다.
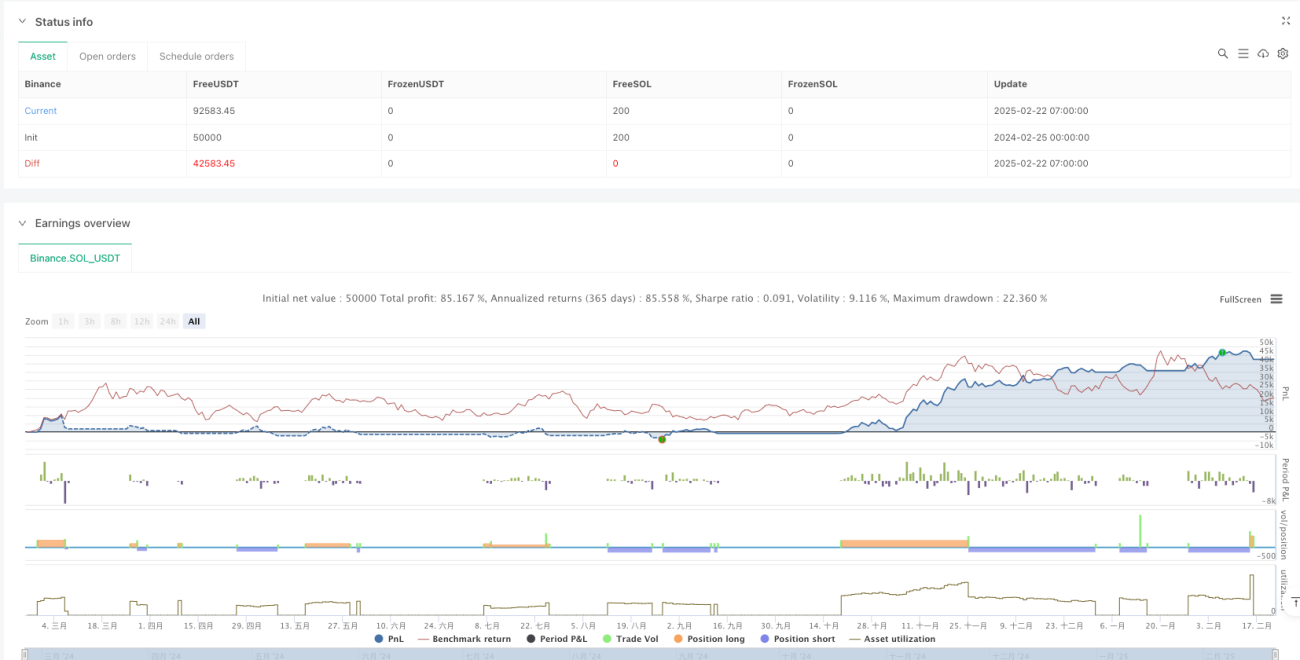
이것은 잘 설계된 트렌드 추적 전략으로, 여러 기술 지표의 연동 작용을 통해 거래 신호의 신뢰성을 향상시키고, 전문적인 위험 관리 시스템을 갖추고 있다. 전략은 확장성이 강하여, 일일 거래에 사용할 수 있으며, 더 장기적인 추세를 파악하는 데에도 적합하다. 제안된 최적화 방향에 의해, 전략에는 추가적인 향상 가능성이 있다. 실장 적용 시, 먼저 재측 환경에서 파라미터 설정을 충분히 검증하고, 특정 시장 특성에 따라 타겟 조정하는 것이 좋습니다.
/*backtest
start: 2024-02-25 00:00:00
end: 2025-02-22 08:00:00
period: 1h
basePeriod: 1h
exchanges: [{"eid":"Binance","currency":"SOL_USDT"}]
*/
// This Pine Script™ code is subject to the terms of the Mozilla Public License 2.0 at https://mozilla.org/MPL/2.0/
// © blockchaindomain719
//@version=6
strategy("The Money Printer v2", overlay=true, default_qty_type=strategy.percent_of_equity, default_qty_value=5)
// === INPUTS ===
ema1_length = input(20, "Fast EMA")
ema2_length = input(50, "Slow EMA")
rsi_length = input(14, "RSI Length")
rsi_overbought = input(70, "RSI Overbought")
rsi_oversold = input(30, "RSI Oversold")
macd_fast = input(12, "MACD Fast")
macd_slow = input(26, "MACD Slow")
macd_signal = input(9, "MACD Signal")
atr_length = input(14, "ATR Length")
atr_mult = input(2.5, "ATR Multiplier for Stop-Loss")
trailing_mult = input(3.5, "Trailing Stop Multiplier")
use_volume = input(true, "Use Volume Filter?")
volume_mult = input(2.0, "Min Volume Multiplier")
capital_risk = input(2.0, "Risk Per Trade (%)") / 100
// === CALCULATE INDICATORS ===
ema1 = ta.ema(close, ema1_length)
ema2 = ta.ema(close, ema2_length)
rsi = ta.rsi(close, rsi_length)
macd_line = ta.ema(close, macd_fast) - ta.ema(close, macd_slow)
macd_signal_line = ta.ema(macd_line, macd_signal)
macd_hist = macd_line - macd_signal_line
atr = ta.atr(atr_length)
volume_filter = not na(volume) and volume > ta.sma(volume, 20) * volume_mult
// === ENTRY CONDITIONS ===
longEntry = ta.crossover(ema1, ema2) and rsi > rsi_oversold and macd_hist > 0 and (not use_volume or volume_filter)
shortEntry = ta.crossunder(ema1, ema2) and rsi < rsi_overbought and macd_hist < 0 and (not use_volume or volume_filter)
// === DYNAMIC RISK MANAGEMENT ===
capital = strategy.equity
risk_amount = capital * capital_risk
trade_size = risk_amount / math.max(atr * atr_mult, 1)
// Stop-Loss & Trailing Stop Calculation
longSL = close - (atr * atr_mult)
shortSL = close + (atr * atr_mult)
longTS = close - (atr * trailing_mult)
shortTS = close + (atr * trailing_mult)
// === EXECUTE TRADES ===
if longEntry
strategy.entry("Long", strategy.long, qty=trade_size)
strategy.exit("Trailing Stop", from_entry="Long", stop=longTS)
if shortEntry
strategy.entry("Short", strategy.short, qty=trade_size)
strategy.exit("Trailing Stop", from_entry="Short", stop=shortTS)
// === ALERTS ===
alertcondition(longEntry, title="BUY Signal", message="💎 Money Printer Bot: Buy Now!")
alertcondition(shortEntry, title="SELL Signal", message="🔥 Money Printer Bot: Sell Now!")
// === PLOTTING INDICATORS ===
plot(ema1, title="Fast EMA", color=color.blue, linewidth=2)
plot(ema2, title="Slow EMA", color=color.orange, linewidth=2)
// RSI Indicator
hline(rsi_overbought, "RSI Overbought", color=color.red)
hline(rsi_oversold, "RSI Oversold", color=color.green)
plot(rsi, title="RSI", color=color.purple)
// MACD Histogram
plot(macd_hist, title="MACD Histogram", color=color.green, style=plot.style_columns)
// ATR Visualization
plot(atr, title="ATR", color=color.gray)
// Buy & Sell Markers
plotshape(series=longEntry, location=location.belowbar, color=color.green, style=shape.labelup, title="BUY")
plotshape(series=shortEntry, location=location.abovebar, color=color.red, style=shape.labeldown, title="SELL")