다중 이동 평균 추세 모멘텀 크로스오버 트레이딩 시스템

개요
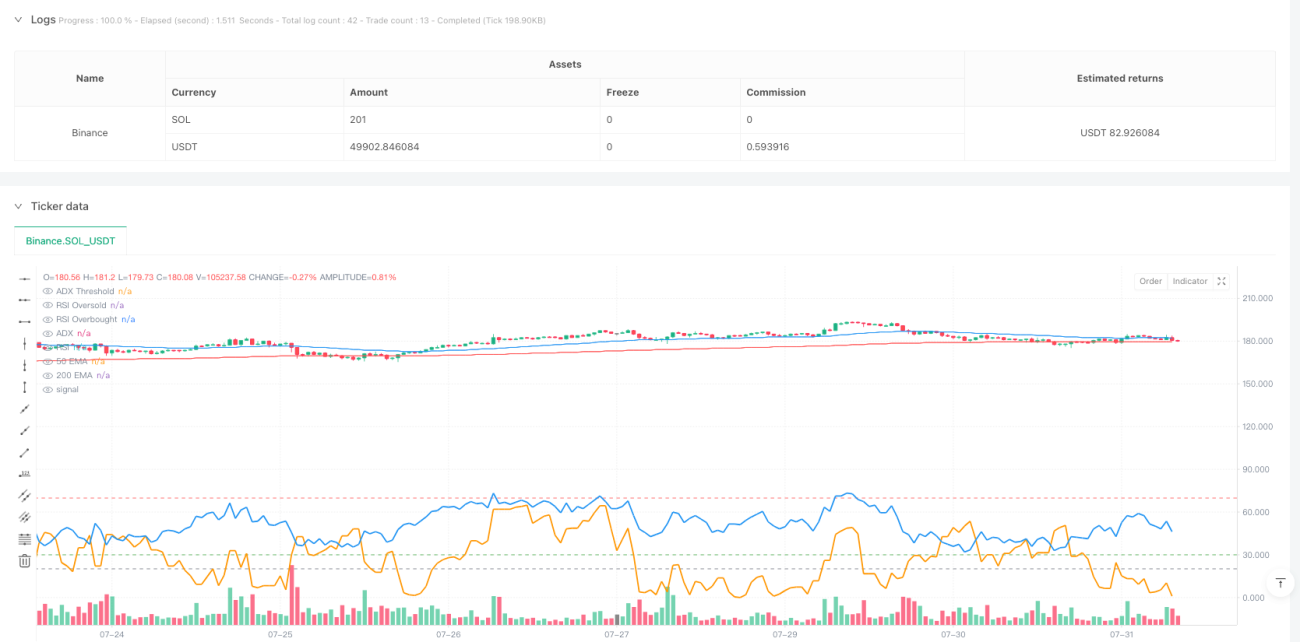
이 전략은 다중 기술 지표에 기반한 트렌드 추적 시스템으로, 이동 평균 (EMA), 평균 트렌드 지표 (ADX) 및 상대적으로 약한 지표 (RSI) 의 장점을 결합합니다. 50일 및 200일 지수 이동 평균의 교차로 시장의 추세를 식별하면서, ADX 필터링 약한 추세를 활용하고, RSI를 사용하여 과도하게 구매되거나 과도하게 판매되는 지역을 피하는 거래를합니다. 전략은 실제 파동에 기반한 동적 중지 손실 및 수익 목표를 채택하여 위험을 통제하고 수익을 극대화합니다.
전략 원칙
전략의 핵심 논리는 다음과 같은 핵심 요소에 기초합니다.
- 트렌드 판단: 빠른 EMA ((50일) 와 느린 EMA ((200일) 의 교차를 이용하여 시장 트렌드 방향을 결정한다. 50일 EMA 위에 200일 EMA를 넘으면 상승 트렌드에 진입하는 것을 나타내고, 50일 EMA 아래에 200일 EMA를 넘으면 하향 트렌드에 진입하는 것을 나타낸다.
- 트렌드 강도 확인: 트렌드 강도를 측정하기 위해 ADX 지표를 사용하며, ADX 값이 20 이상일 때만 입시를 고려하고, 강한 트렌드에서만 거래하는 것을 보장합니다.
- 동력 필터링: RSI 지표를 통해 동력 필터링을 수행하고, RSI가 30-70 사이일 때만 포지션을 열고, 과도하게 구매하거나 과도하게 판매하는 지역 거래를 피하십시오.
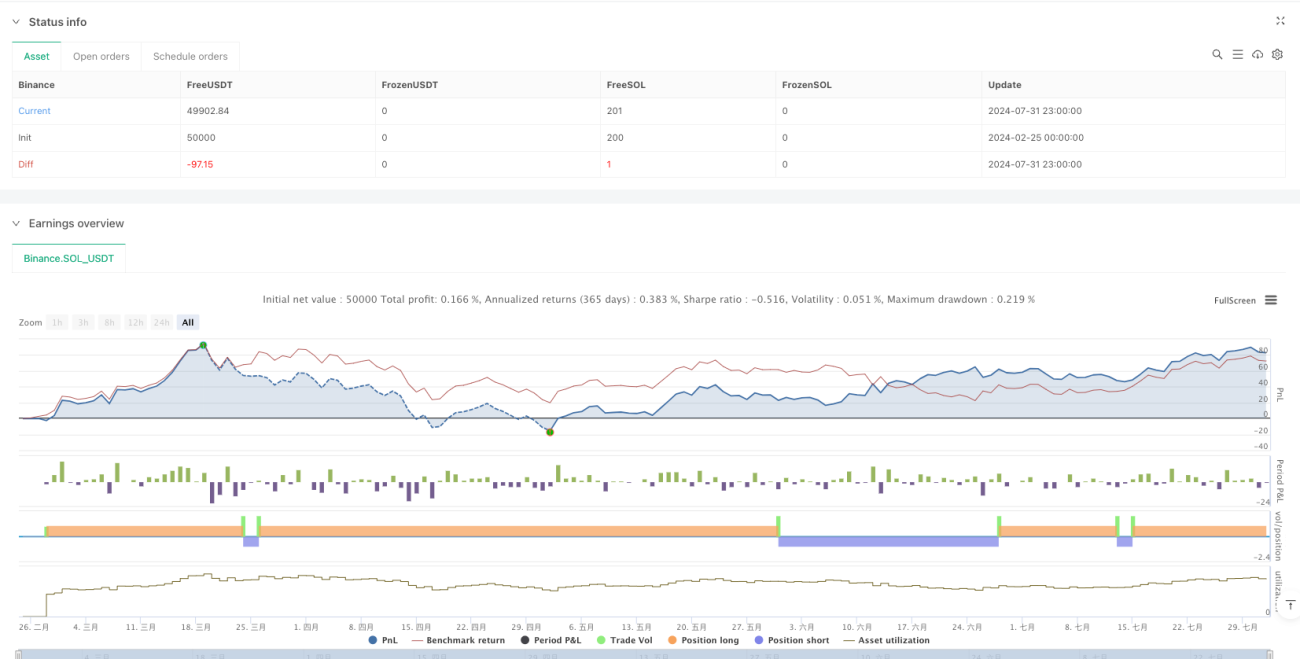
- 위험 관리: ATR 기반의 동적 중지 및 수익 목표가 사용되며, 중지 손실은 ATR의 2 배로 설정되며, 수익 목표는 ATR의 4 배로 설정됩니다.
전략적 이점
- 다차원 트렌드 확인: 평행선 교차, ADX 및 RSI 삼중 필터링을 결합하여 거래 신호의 신뢰도를 크게 향상시킵니다.
- 다이내믹 리스크 관리: ATR 기반의 다이내믹 스톱로스 및 수익 설정, 시장의 변동성에 따라 자율적으로 조정할 수 있다.
- 약한 트렌드 필터: ADX 지표의 도입은 수평 시장에서 자주 거래되는 것을 효과적으로 방지했다.
- RSI 필터링 메커니즘은 극한 지역에서 거래하는 것을 피할 수 있습니다.
전략적 위험
- 트렌드 반전의 위험: 급격한 반전 시, 평행선 시스템의 지연성은 더 큰 회전을 초래할 수 있다.
- 시장의 흔들림 위험: 시장이 지대적 흔들림에 있을 때, 빈번한 가짜 브레이크 신호가 발생할 수 있다.
- 매개 변수 민감성: 여러 지표의 매개 변수 설정은 다른 시장 환경에 최적화해야 한다.
- 슬라이드 포인트 위험: 유동성이 낮은 시장에서 실제 거래 가격은 신호 가격과 큰 편차가 있을 수 있다.
전략 최적화 방향
- 거래량 지표 도입: 거래량 확인 메커니즘을 추가하는 것을 고려할 수 있으며, 거래량이 돌파될 때만 거래한다.
- 최적화된 스톱 로즈 메커니즘: 트렌드 개발 과정에서 이미 이익을 보호하기 위해 추적 스톱 로즈를 사용할 수 있습니다.
- 시간 필터를 추가: 거래 시간 필터를 추가하여 변동성이 높은 시간에 거래하는 것을 피할 수 있습니다.
- 시장 환경 분류: 다양한 시장 환경에 따라 ((트렌드, 흔들림) 동적으로 조정하는 전략 파라미터.
요약하다
이 전략은 여러 가지 기술 지표를 통합하여 전체적인 트렌드 추적 거래 시스템을 구축한다. 전략의 장점은 다차원적인 신호 확인 장치와 동적인 위험 관리 시스템이지만, 트렌드 반전과 흔들리는 시장에서 발생하는 위험에 주의를 기울여야 한다. 지속적인 최적화와 개선으로 이 전략은 다양한 시장 환경에서 안정적인 성능을 유지할 수 있을 것으로 보인다.
Overview
This strategy is a trend-following system based on multiple technical indicators, combining the advantages of Exponential Moving Averages (EMA), Average Directional Index (ADX), and Relative Strength Index (RSI). It identifies market trends through the crossover of 50-day and 200-day EMAs, filters weak trends using ADX, and avoids trading in overbought or oversold areas using RSI. The strategy employs dynamic stop-loss and take-profit targets based on Average True Range (ATR), ensuring both risk control and profit maximization.
Strategy Principles
The core logic of the strategy is built on the following key elements:
- Trend Identification: Uses the crossover of fast EMA (50-day) and slow EMA (200-day) to determine market trend direction. A bullish trend is signaled when the 50-day EMA crosses above the 200-day EMA, and a bearish trend when it crosses below.
- Trend Strength Confirmation: Utilizes the ADX indicator to measure trend strength, only considering entry when ADX is above 20, ensuring trades only in strong trends.
- Momentum Filtering: Applies RSI indicator for momentum filtering, only entering positions when RSI is between 30-70, avoiding trades in overbought or oversold areas.
- Risk Management: Uses ATR-based dynamic stop-loss and take-profit levels, with stop-loss set at 2x ATR and take-profit at 4x ATR.
Strategy Advantages
- Multi-dimensional Trend Confirmation: Combines EMA crossover, ADX, and RSI triple filtering to significantly improve signal reliability.
- Dynamic Risk Management: ATR-based dynamic stop-loss and take-profit settings adapt to market volatility.
- Weak Trend Filtering: Introduction of ADX effectively avoids frequent trading in ranging markets.
- Prevention of Extreme Entries: RSI filtering mechanism prevents trading in extreme areas.
Strategy Risks
- Trend Reversal Risk: The lag in moving average systems may lead to significant drawdowns in quick reversal scenarios.
- Range-bound Market Risk: May generate frequent false breakout signals during sideways markets.
- Parameter Sensitivity: Multiple indicator parameters need optimization across different market conditions.
- Slippage Risk: Actual execution prices may significantly deviate from signal prices in less liquid markets.
Strategy Optimization Directions
- Volume Indicator Integration: Consider adding volume confirmation, only trading on volume breakouts.
- Stop-loss Mechanism Enhancement: Consider implementing trailing stops to protect profits during trend development.
- Time Filter Addition: Add trading time filters to avoid high-volatility periods.
- Market Environment Classification: Dynamically adjust strategy parameters based on different market conditions (trending, ranging).
Summary
The strategy constructs a comprehensive trend-following trading system through the integrated use of multiple technical indicators. Its strengths lie in multi-dimensional signal confirmation and dynamic risk management systems, while attention must be paid to risks from trend reversals and ranging markets. Through continuous optimization and refinement, the strategy has the potential to maintain stable performance across different market environments.
- 1