
개요
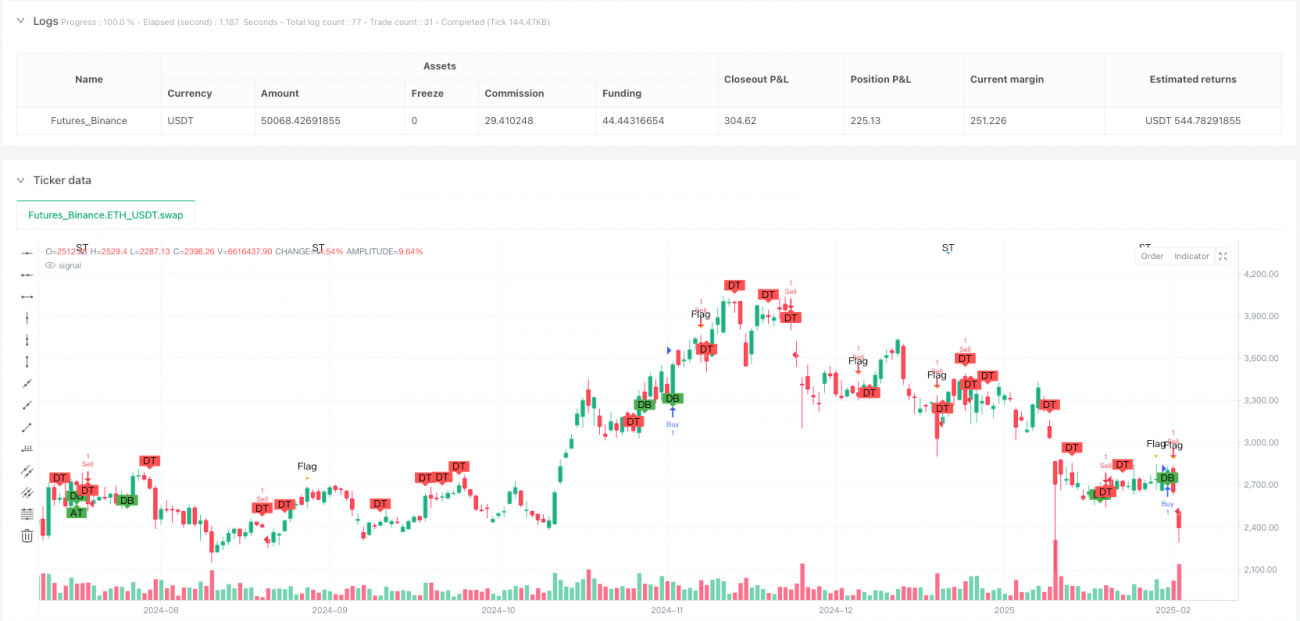
기술 그래프 확인형 다중주기 운동 전략은 여러 종류의 고전적인 그래프 형태를 인식하고 동력을 확인하는 거래 시스템이다. 이 전략은 주로 시장에서 흔히 볼 수 있는 기술 형태를 식별하는 것, 예를 들어, 머리 어깨 윗부분, 머리 어깨 밑부분, 쌍 윗부분, 쌍 밑부분, 삼각형 (대칭, 상승, 하락), 깃발 모양, <unk> 모양 등으로, 형태가 돌파할 때 입문 신호를 확인한다. 이 전략은 ATR 지표를 교묘하게 결합하여 동적인 중지 손실 및 <unk> 수준을 설정하고, 위험을 효과적으로 제어하고 수익을 잠금한다. 이 전략은 시장의 다양한 전환점을 포착할 수 있을 뿐만 아니라, 형태가 돌파되는 것을 확인하는 메커니즘을 통해 거래 신호의 신뢰성을 높이고, 가짜 돌파의 위험을 줄인다.
전략 원칙
이 전략의 핵심은 일련의 조건 함수를 통해 다양한 그래프 형태를 식별하고 가격이 중요한 수준을 넘어서면 거래 신호를 확인하는 것입니다.
-
머리 어깨 위/머리 어깨 아래 식별: 연속적인 고점/저점의 상대적 위치 관계를 비교하여, 머리 어깨 형태의 특징 구조를 식별한다. 높점 1이 높점 0, 2, 3, 4보다 크고, 높점 0이 높점 2와 3보다 작을 때, 머리 어깨 형태가 형성된다.
-
이중 상단/이중 하단 식별: 고위점/저위점 연속을 분석하여 양극점과 양극점 형태를 식별한다. 양극점 형태에서는 고위점 1이 주변 고위점보다 크며, 양극점 형태에서는 저위점 1이 주변 저위점보다 작아야 한다.
-
삼각형 모양 인식:
- 대칭 삼각형: 높이가 낮아지고 낮이가 상승하여 수렴형태를 형성한다
- 상승 삼각형: 높은 지점은 상대적으로 안정되고 낮은 지점에서는 상승하여 상향상태를 형성한다
- 하락 삼각형: 고점은 하락하고 낮은점은 비교적 안정적으로 유지되어 하락형태를 형성한다
-
깃발 모양/삼각형 깃발 식별: 고점과 저점의 연속적인 변화 패턴을 분석하여 식별한다.
-
거래 신호 확인:
- 다중 머리 신호: 상하, 쌍하, 또는 상승 삼각형으로 인식되고, 상장 가격이 이전 K 선의 고점을 돌파했을 때 트리거
- 공백 신호: 쌍 꼭대기, 하향 삼각형 또는 깃발 모양을 인식하고, 상장 가격이 전 K선 최저점으로 떨어졌을 때 트리거
-
위험 관리:
- 14주기 ATR을 사용하여 동적 중지 및 정지 수준을 계산
- 스톱로스는 1.5배 ATR로 설정되어 있습니다.
- 3배의 ATR으로 설정되어 있고, 위험과 수익의 비율은 1:2입니다.
전략적 이점
-
체계화된 형상 인식: 전략은 명확한 조건 함수를 정의하여 여러 가지 클래식 그래프 형태를 자동으로 인식하여 주관적 판단으로 인한 편차를 감소시킵니다.
-
신호 확인 메커니즘전략은 차트 형태를 인식하는 것뿐만 아니라, 가격의 중요한 수준을 통과하는 것을 확인하는 것으로, 가짜 돌파구를 초래하는 위험을 줄입니다.
-
동적 위험 관리: ATR 지표를 사용하여 동적 중지 및 중지 수준을 설정하여 시장의 변동성에 대한 위험을 조절합니다.
-
다형적 커버전략: 전략은 여러 클래식 차트 형식을 포함하고, 거래 기회를 증가시키고, 다양한 시장 환경에 적응한다.
-
시각화: 전략은 plottshape 함수를 통해 그래프 상에 직관적으로 인식 된 다양한 형태를 표시하여 거래자가 전략 논리를 이해하고 검증하는 데 도움이됩니다.
-
**위험과 이익이 합리적일 수 있습니다.**이 전략은 3배의 ATR을 스톱으로, 1.5배의 ATR을 스톱으로, 리스크 수익률은 1:2로, 효과적인 리스크 관리 원칙에 부합한다.
전략적 위험
-
형상 인식 정확도가 제한되어 있습니다.: 현재 형태 인식 알고리즘은 상대적으로 단순화되어 있으며, 특히 시장 소음이 큰 경우, 잘못된 판단이나 미처 판단이 발생할 수 있습니다.
-
매개변수 민감도ATR 주기의 설정과 중지, 중지의 배수의 설정은 전략의 성능에 중요한 영향을 미치며, 다른 시장과 시간 프레임에 따라 최적화가 필요합니다.
-
가짜 침입 위험하지만, 시장에서 가짜 브레이크가 발생하여 불필요한 거래 손실이 발생할 수 있습니다.
-
형태 반복 인식: 현재 코드의 일부 형태 인식 함수의 논리는 비슷하다 (예를 들어, 머리 어깨 톱과 쌍 톱), 동일한 시장 상황에서 여러 신호를 유발하여 거래 빈도와 비용을 증가시킬 수 있다.
-
트렌드 필터 부족이 전략은 전체 시장의 경향 방향을 고려하지 않고, 강한 추세에서 역전 신호를 생성하여 역전 거래로 이어질 수 있다.
위험 회피 방법:
- 거래량 확인, 트렌드 지표 필터링과 같은 추가 필터링 조건을 추가합니다.
- 형상 인식 알고리즘을 최적화하고, 더 많은 조건 검증을 추가합니다
- 더 보수적인 포지션 관리
- 중요한 뉴스나 사건 전후 거래를 피하기 위해 시간 필터를 추가하는 것을 고려하십시오.
- 더 넓은 재검토를 통해 최적의 변수 조합을 찾습니다.
전략 최적화 방향
-
형상 인식 알고리즘 개선:
- 더 많은 검증 조건을 추가합니다. 예를 들어, 형태의 크기, 형성 시간, 가격 변화의 정도 등
- 머리, 어깨, 두개 등 비슷한 형태를 구분하는 기준
- 더 복잡한 형태를 추가합니다. 컵 핸드 형태, 상승/하강 <unk> 형태 등
-
수량 확인:
- 형식적 돌파구에서 거래량을 증가시키는 확증 조건
- 형태 형성의 과정에서 거래량 변화 패턴을 분석
-
트렌드 필터:
- 트렌드 지표 (예를 들어 이동 평균, ADX 등) 를 추가하여 트렌드 방향과 형태 신호가 일치하는 경우에만 거래합니다.
- 더 긴 시기를 고려하는 시장 구조
-
최적화된 위험 관리:
- 다른 ATR 배수 설정을 테스트합니다.
- 변동률 기반의 동적 포지션 관리를 구현
- '조작금지 전략'을 고려하고, '이윤의 일부'를 잠금화하는 것
-
필터링 시간을 추가합니다.:
- 낮은 변동성이나 중요한 뉴스 발표 전에 거래하지 마십시오.
- 시장의 계절적 요소를 고려하는 것
-
다중 시간 프레임 분석:
- 더 높은 시간 프레임에 대한 트렌드 방향 확인
- 더 짧은 시간 프레임에 최적화된 입학점
이러한 최적화 방향은 다음과 같은 이유로 전략의 안정성과 효율성을 크게 향상시킬 것입니다.
- 더 정확한 형태 인식으로 잘못된 신호를 줄일 수 있습니다.
- 수송량 확인은 신호 신뢰도를 높인다.
- 트렌드 필터링, 역동 거래 방지
- 위험관리를 최적화하여 자금 효율성과 보호
- 다중 시간 프레임 분석은 시장에 대한 보다 포괄적인 시각을 제공합니다.
요약하다
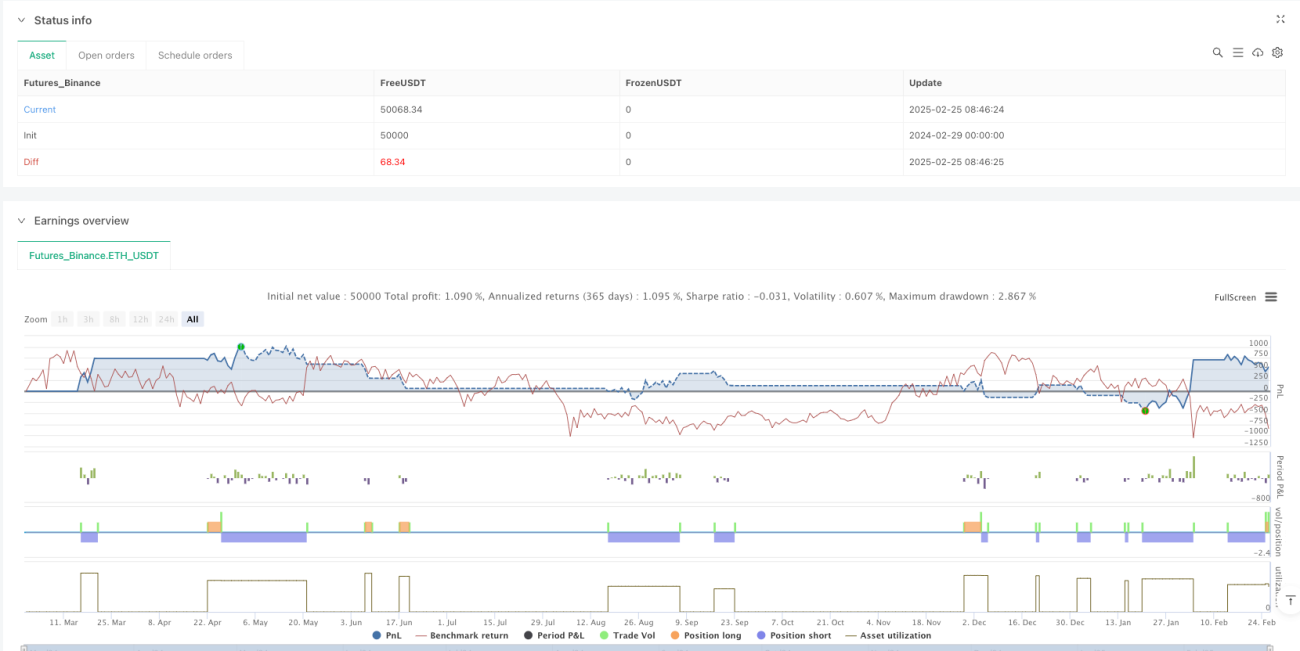
기술 그래프 확인형 다중 주기 동적 전략은 체계화 된, 규칙이 명확한 거래 시스템으로, 여러 가지 고전적인 차트 형태를 식별하고 브레이크 확인과 결합하여 거래 신호를 생성한다. 전략은 ATR 지수를 사용하여 동적 위험 관리를 수행하고, 합리적인 위험 수익률을 설정한다. 현재의 버전의 형태 식별 알고리즘은 상대적으로 단순화되었지만, 추가적인 최적화를 위해 좋은 토대를 제공합니다. 거래량 확인, 트렌드 필터링, 위험 관리 및 다중 시간 프레임 분석을 최적화하는 등의 개선 사항을 추가함으로써, 이 전략은 강력하고 안정적인 거래 시스템이 될 잠재력을 가지고 있습니다. 이러한 기술 형태에 기반한 전략은 특히 시장의 변동성과 가격 행동이 명백한 상품에 적합하며, 거래 시스템이 시장의 전환점과 돌파구를 포착하는 데 도움이 될 수 있습니다.
- 1