
전략 개요
이 양적 거래 전략은 상대적으로 약한 지수 (RSI) 와 지수 이동 평균 (EMA) 의 장점을 교묘하게 결합하고, 필터링 메커니즘으로 다중 시간 프레임 분석을 도입한다. 이 전략의 핵심은 일선 및 둘레 RSI 지표의 협동 확인을 중심으로 설계되었으며, EMA를 통해 트렌드 전환점을 교차하여 지속적인 동력을 갖는 양 거래 기회를 식별하는 것을 목표로 한다. 이 전략은 적응된 출입 논리를 채택하고, 여러 기술 지표의 교차 검증을 활용하여 거래 신호의 신뢰성을 효과적으로 향상시킨다.
전략 원칙
이 전략은 다음과 같은 핵심 원칙을 바탕으로 설계되었습니다.
-
다중 시간 프레임 RSI 필터:
- 일선 RSI가 주요 신호 생성 소스
- 회로 RSI는 트렌드 확인 필터로, 거래 방향이 더 큰 주기적 트렌드와 일치하는지 확인합니다.
- 구매 조건은 주위 RSI>55이고, 일간 RSI>55입니다.
- 판매 조건은 주경 RSI <45, 일경 RSI <45
-
EMA 교차 시스템:
- 13주기 및 21주기 EMA 교차를 주요 입력 신호로 사용
- 34주기 및 55주기 EMA는 지지/저항 지점과 출전 참조를 제공합니다.
- 빠른 EMA ((13주기) 를 통과하는 느린 EMA ((21주기) 는 구매 신호를 유발합니다.
- 빠른 EMA 아래에서 느린 EMA 트리거를 통해 판매 신호
-
신호 확인 메커니즘:
- 거래는 EMA 교차 신호가 두 시간 프레임의 RSI 방향과 일치하는 경우에만 수행됩니다.
- request.security 함수를 통해 다른 시간 프레임의 데이터 통합을 구현합니다.
- 다중 조건 필터링은 가짜 신호와 흔들림 상황에서 자주 거래하는 것을 줄입니다.
-
정확한 출전 전략:
- 다수 출전 조건은 EMA1 아래 EMA3를 통과하거나 가격이 EMA4를 넘어간다.
- 빈 머리 출전 조건은 EMA1에 EMA3를 입거나 가격이 EMA4를 돌파한다.
- 평지 상장 논리 및 개시 조건 독립, 위험 제어에 더 중점을 둔
전략적 이점
코드 분석을 통해, 이 전략은 다음과 같은 중요한 장점을 가지고 있다고 결론지었습니다.
-
다단계 신호 필터링 시스템:
- 단기 및 장기 RSI를 통합하여 가짜 브레이크 위험을 줄입니다.
- 다중 EMA와 결합하여 역동적으로 저항 영역을 지원하여 신호 품질을 향상시킵니다.
- 다중 인증 메커니즘은 '동기 시장'에서 유효하지 않은 거래를 크게 줄였습니다.
-
적응력 있는 트렌드 식별:
- 트렌드가 성숙할 때까지 기다리지 않고, 트렌드 초기에 조기 개입할 수 있는 능력
- 주류 RSI의 고급 필터링을 통해 주요 트렌드 방향과 반대되는 거래를 피하십시오.
- EMA 교차 시스템은 시장 소리에 대한 자연 필터링 역할을합니다.
-
좋은 위험 관리 시스템:
- 뚜렷한 출전 조건을 설계하고 감정적 입장을 피하십시오.
- 역전 신호가 발생하면 자동으로 포지션을 평정하고, 효과적으로 철수를 제어합니다.
- 평점 이후의 역전시설을 설계하여 자본 효율을 높여라
-
고도의 사용자 정의:
- 모든 핵심 매개 변수는 input 함수를 통해 조정할 수 있습니다.
- RSI 마이너스 및 EMA 길이를 개별적으로 조정하여 시장 환경에 맞게 조정할 수 있습니다.
- 다양한 품종 특성에 따라 신호 민감도를 사용자 정의 할 수 있습니다.
전략적 위험
이 전략은 합리적으로 설계되었지만 다음과 같은 잠재적인 위험과 한계가 있습니다.
-
매개변수 민감도:
- RSI와 EMA의 선택이 전략에 큰 영향을 미칩니다.
- 너무 민감한 변수는 과도한 거래로 이어질 수 있습니다.
- 해결 방법: 역학적 데이터에 기반한 변수 최적화 및 재검토를 통해 과다 적합성을 방지합니다.
-
시장의 부진으로 인한 지진:
- 명백한 추세가 없는 가로수지 시장에서 빈번한 가짜 신호가 발생할 수 있다.
- EMA 교차전략은 흔들리는 시장에서 자연스러운 약점입니다.
- 해결 방법: 변동율 필터 또는 트렌드 강도 지표를 추가하여 낮은 트렌드 강도 환경에서 자동으로 지분 비율을 낮추는 방법
-
뒤처진 문제:
- EMA와 RSI는 지연된 지표이며, 급격한 변동 시장에서 반응하지 않을 수 있습니다.
- 신호 확인 과정에서 최적의 출입점을 놓칠 수 있습니다.
- 해결 방법: 거래량이나 가격 형태 식별과 같은 미래지향적 지표를 도입하는 것을 고려하십시오.
-
신호는 희박합니다.:
- 다중 조건 필터링은 거래 신호를 줄일 수 있습니다.
- 낮은 변동성 환경에서는 장기간 거래 기회가 없을 수 있습니다.
- 해결 방법: 보조 거래 신호를 추가하거나 적절한 완화 조건 요구 사항을 고려하십시오
전략 최적화 방향
코드 분석을 바탕으로, 이 전략의 최적화 방향은 다음과 같습니다.
-
자기 적응 변수 시스템:
- RSI 하락과 EMA 주기의 동적 조정, 시장의 변동성에 따라 자동으로 최적화
- ATR (Average True Rate) 지표가 추가되어 시장의 변동에 따라 중지 위치를 조정합니다.
- 시장 상태 분류를 도입하고, 트렌드 및 변동 시장에서 다른 파라미터 설정을 사용합니다.
-
신호 품질을 향상:
- 통합 트랜지먼트 확인 메커니즘, 신호가 발생하면 트랜지먼트 증가와 함께 요구
- 마감 가격 EMA를 안정적으로 요구하는 것과 같은 가짜 브레이크를 대상으로 한 가격 행동 필터링을 추가합니다.
- 트렌드 강도 지표인 ADX를 도입하여 트렌드 강도에서만 포지션 거래를 완료합니다.
-
자금 관리 개선:
- 유동적 지위 관리를 구현하고, 높은 변동성 환경에서 자동으로 지위를 감소시킵니다.
- 피라미드 전략의 도입, 트렌드가 확인된 후 지분을 더 많이 보유
- 위험과 수익에 기반한 지능형 손해 방지 시스템을 설계
-
다 시장 적응성:
- 상품 특성 분석을 추가하여 다양한 카테고리의 품종에 대한 전략 파라미터를 자동으로 조정합니다.
- 시장 관련성 분석을 구현하고 과도한 위험 집중을 피하십시오.
- 일일 및 장기 주기 신호 연동 장치를 추가하여 다단계 거래 시스템을 형성합니다.
요약하다
다중 시간 프레임 RSI와 EMA 교차량 동력 전략은 정교하게 설계된 정량 거래 시스템으로, 다른 시간 주기 RSI 지표와 다중 EMA를 통합하여 세 개의 신호 생성 및 필터링 메커니즘을 구축한다. 이 전략의 핵심 장점은 다중 계층 확인 시스템으로, 트렌드 전환점을 효과적으로 포착하고, 흔들리는 시장에서 자주 거래되는 것을 피할 수 있다.
전략의 위험은 주로 매개 변수 민감성 및 변동 시장의 성능에 집중되지만, 적응 매개 변수 시스템 및 강화 된 시장 상태 식별 메커니즘을 도입함으로써 이러한 위험을 효과적으로 완화 할 수 있습니다. 미래의 최적화 방향은 신호 품질 향상, 동적 매개 변수 조정 및 지능형 자금 관리를 중심으로 전개되어야합니다.
전체적으로 보면, 이 전략은 논리적으로 명확하고, 설계적으로 합리적이며, 실제적인 가치를 가진 양적 거래 시스템이다. 정교한 조정과 지속적인 최적화를 통해, 적응력이 강한, 위험 조절이 가능한 장기 거래 프로그램으로 발전할 수 있다.
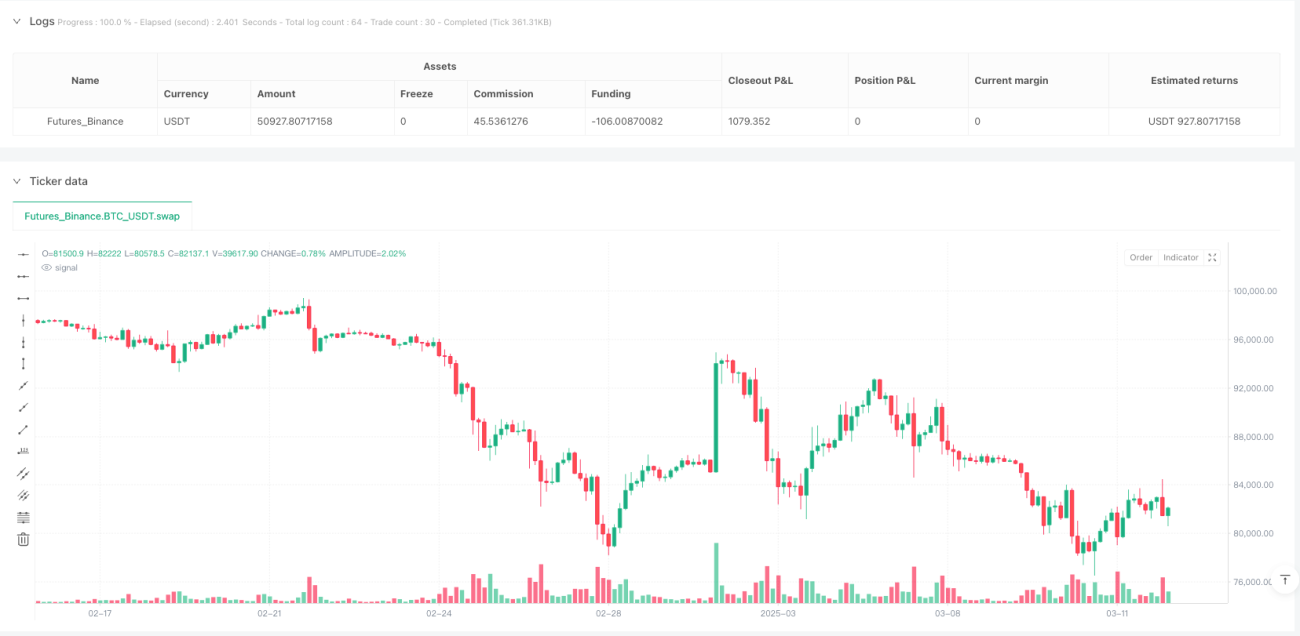
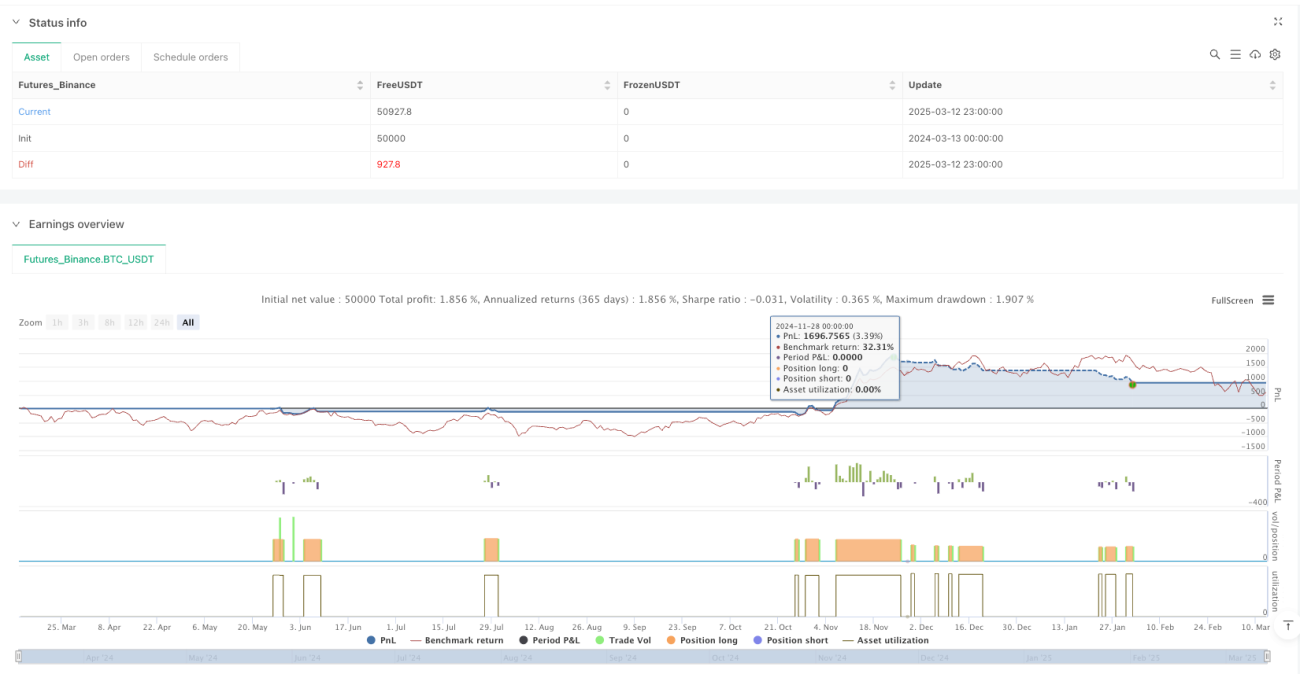
/*backtest
start: 2024-03-13 00:00:00
end: 2025-03-13 00:00:00
period: 3h
basePeriod: 3h
exchanges: [{"eid":"Futures_Binance","currency":"BTC_USDT"}]
*/

//@version=6
strategy("RSI & EMA Crossover Strategy with Daily & Weekly RSI Filter", overlay=true, default_qty_type=strategy.percent_of_equity, default_qty_value=10)

// === INPUTS ===- 1