
다중 지표 합의 거래 전략은 3개의 서로 다른 기술 지표를 결합하여 지표 간의 상호 검증을 통해 거래 신호를 확인하는 양적 거래 시스템이다. 이 전략은 유동성 가중 초고속 트렌드 (LWST), 트렌드 신호 시스템 및 강화형 파동 트렌드 진동기를 (WT) 통합하고 있으며, 적어도 두 지표가 동일한 방향으로 신호를 제공 할 때만 구매 또는 판매 작업을 수행한다. 이 합의 메커니즘은 신호의 신뢰성을 크게 높이고, 가짜 돌파구로 인한 손실을 줄인다. 동시에, 전략은 내장된 손실 중지 및 차단 메커니즘을 갖추고 있으며, 각 거래에 대한 위험 제어 프레임워크를 제공합니다.
다중 지표 합의 거래 전략의 핵심 원칙은 시장 상태를 다차원적으로 분석하여 거래 방향을 확인하는 것입니다.
유동성 가중 슈퍼 트렌드 (LWST): ATR와 트래픽 정보를 결합하여 동적으로 지원하는 저항대를 만듭니다. 이 지표는 전통적인 슈퍼 트렌드 지표와 트래픽 웨이트를 결합하여 트래픽이 높은 지역에서 대역폭을 더 민감하게 만듭니다. 계산 과정은 다음과 같습니다:
트렌드 신호 시스템: 쌍 EMA 시스템을 사용하여 가격 트렌드를 탐지한다. 빠른 EMA와 느린 이동 평균의 비율 차이를 비교하여 시장 트렌드 강도를 판단한다. 빠른 EMA가 느린 EMA를 초과하여 설정된 임계값을 달성하면 다중 헤드 신호가 발생한다. 반대로 공백 신호가 발생한다.
강화형 파동 트렌드 진동기 ((WT): 가격과 평평한 값의 오차 정도를 기반으로 오차 값을 계산하고, 과매매 상태를 식별합니다. 이 지표는 다음과 같은 단계를 통해 신호를 생성합니다:
공감 신호 메커니즘전략: 적어도 두 개의 지표가 일치할 때만 거래를 수행한다. 이것은 다중 지표 수를 계산하여 수행된다. (영역은 3 ~ 3) 값이 2보다 크면 구매 신호를 발생시키고, 2보다 작으면 판매 신호를 발생시킨다.
위험 관리: 각 거래는 입시 가격에 기반한 스톱로스 (예작 2%) 와 스톱 포스트 (예작 4%) 를 설정하고, 어느 조건이 충족되면 자동으로 종료한다.
신호 필터링 강화: 여러 지표의 합의가 필요하여 거래가 수행되며, 단일 지표가 생성할 수 있는 잘못된 신호를 크게 줄여 거래의 정확도를 향상시킵니다.
다른 시장 상황에 적응하기세 가지 지표는 각각 다른 시장 속성에 초점을 맞추고 있습니다. 트렌드, 동력, 변동성) 이 전략이 다른 시장 환경에서 유효성을 유지할 수 있도록합니다.
유동성 민감 조정: 유동성 가중 슈퍼 트렌드는 거래량 역동성에 따라 민감성을 조정하여 전략이 유동성이 높은 지역에서 트렌드 변화를 더 빨리 포착하고, 유동성이 낮은 지역에서 더 보수적으로 사용할 수 있습니다.
내장 위험 관리: 사전 설정된 스톱로스 및 스톱스톱 메커니즘은 거래 당 명확한 리스크-이익 비율을 제공하며, 단일 거래의 위험을 허용 가능한 범위 내에서 제어합니다.
직관적인 시각화 도구전략: 실시간 신호 표와 그래픽 표를 제공하여 거래자가 현재 시장 상태와 각 지표 신호를 빠르게 파악할 수 있도록 도와줍니다.
자금 관리 통합: 계정 적당금에 기반한 포지션 크기를 설정하여 지능적인 자금 관리를 구현하고 과도한 위험 틈을 피하십시오.
매개변수 민감도전략: 여러 가지 조정 가능한 매개 변수를 사용하며, 잘못된 매개 변수 설정으로 인해 과도한 최적화 또는 신호 부족이 발생할 수 있습니다. 해결 방법: 전체적인 매개 변수 감수성 분석을 수행하여 여러 시장 조건에서 안정적인 성능을 나타내는 매개 변수 조합을 선택하십시오.
신호 지연: 이동 평균과 다중 지표 확인을 사용하기 때문에 전략이 트렌드 초기에 일부 실적을 놓칠 수 있습니다. 해결 방법: 다른 시간 기간에 대한 다른 파라미터 조합을 설정하거나 더 민감한 단기 지표를 추가하는 것을 고려할 수 있습니다.
수평 시장의 효과는 좋지 않습니다.: 명확한 트렌드가 없는 시장에서, 여러 가지 트렌드 지표가 혼합된 신호를 줄 수 있으며, 이로 인해 거래가 자주 또는 거래가 없습니다. 해결 방법: 수평 시장을 특별히 식별하는 필터를 추가하고, 수평 시장을 식별할 때 거래를 중지하거나 수평을 위해 특별히 설계된 전략으로 전환하십시오.
고정 손실 위험: 고정된 비율의 스톱라인을 사용하면 다른 자산의 변동적 특성에 적응하지 못할 수 있다. 해결 방법: ATR 또는 역사적인 변동률에 따라 스톱라인을 동적으로 조정한다.
자금 관리 위험: 기본으로 100%의 계좌 자금을 사용하는 것은 과도한 위험 집중을 초래할 수 있습니다. 해결 방법: 시장 상태와 신호 강도의 동성에 따라 포지션 크기를 조정하고 분산 거래 전략을 시행하십시오.
동적 변수 조정:
시장 환경 필터 추가:
정지/손실 메커니즘을 최적화:
신호 강도 등급:
시간 필터:
다중 지표 합의 거래 전략은 유동성 가중된 슈퍼 트렌드, 트렌드 신호 시스템 및 강화된 파동 트렌드 진동기를 통합하여 견고한 거래 시스템을 만듭니다. 그것의 핵심 장점은 다중 지표 합의 메커니즘이 신호 신뢰성을 크게 향상시킨다는 것입니다. 유동성 가중된 구성 요소는 전략에 시장의 깊이에 대한 민감성을 더합니다. 내장 된 위험 관리 프레임 워크는 각 거래에 미리 정의된 위험 보상 비율이 있음을 보장합니다.
그럼에도 불구하고, 전략에는 최적화 할 여지가 있으며, 특히 매개 변수 적응성, 시장 상태 인식 및 동적 스톱 로즈 스톱에서 최적화 할 수 있습니다. 권장된 최적화 방향을 구현하여, 특히 시장 환경 필터 및 신호 강도 등급 시스템을 구축하면 다양한 시장 조건에서 적응성과 안정성을 더욱 향상시킬 수 있습니다.
전체적으로, 이것은 경험이 많은 거래자가 실전 이전 테스트와 변수 최적화를 위해 잘 설계된 정량 거래 시스템입니다. 전략의 모듈 디자인은 개인 요구에 따라 쉽게 수정 및 확장 할 수 있습니다.
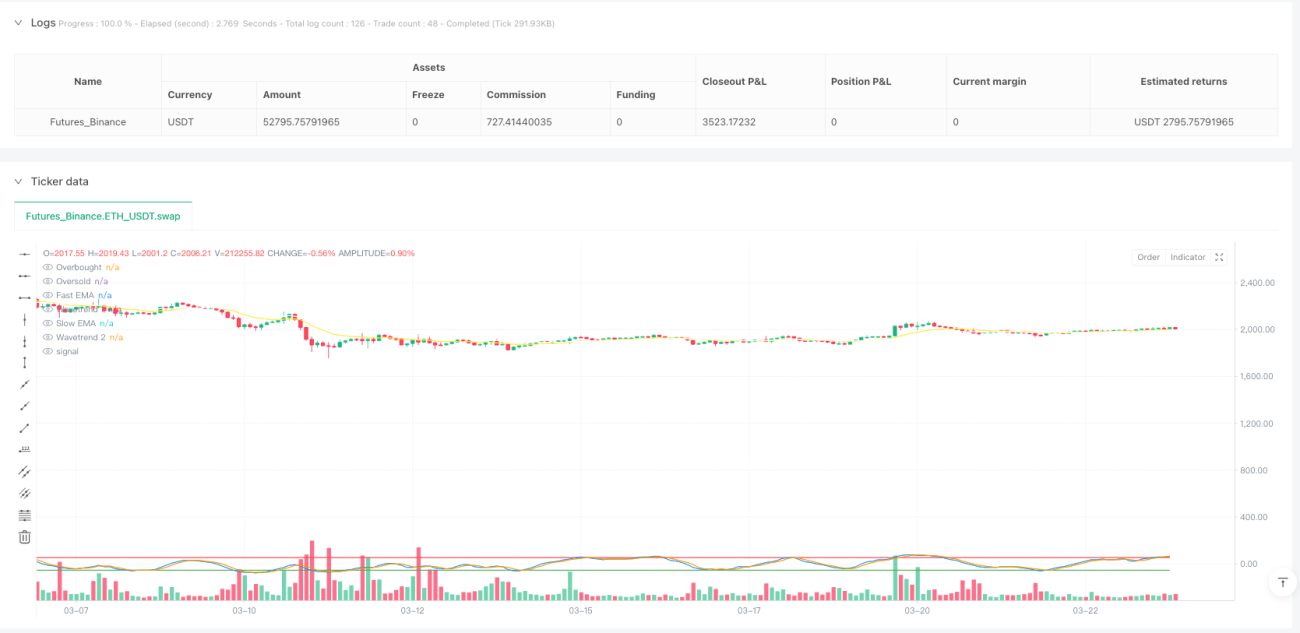
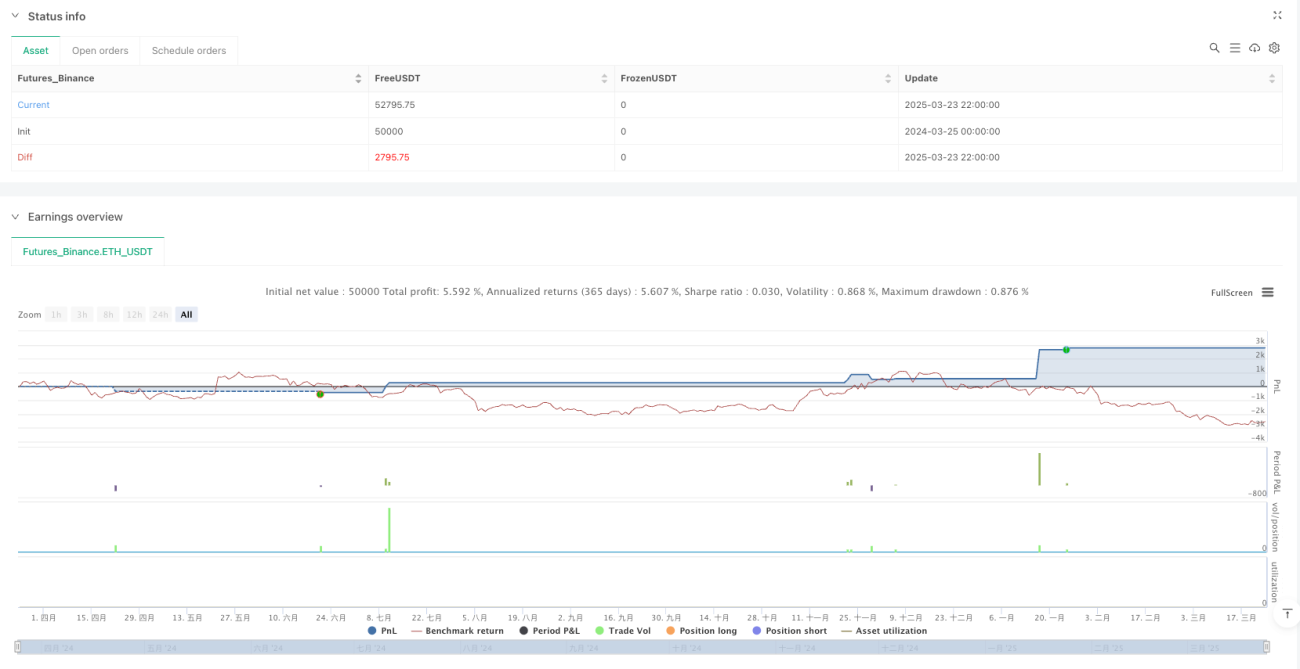
/*backtest
start: 2024-03-25 00:00:00
end: 2025-03-24 00:00:00
period: 2h
basePeriod: 2h
exchanges: [{"eid":"Futures_Binance","currency":"ETH_USDT"}]
*/
//@version=5
strategy("Multi-Indicator Consensus Strategy", overlay=true, initial_capital=100000, default_qty_type=strategy.percent_of_equity, default_qty_value=100)
// =================== Input Parameters ===================
// Liquidity Weighted Supertrend
lwst_period = input.int(10, "LWST Period", minval=1, tooltip="Period for ATR calculation")
lwst_multiplier = input.float(3.0, "LWST Multiplier", minval=0.1, tooltip="Multiplier for ATR bands")
lwst_length = input.int(20, "Volume SMA Length", minval=1, tooltip="Length for volume SMA")
// Trend Signals
trend_length = input.int(14, "Trend Length", minval=1, tooltip="Length for EMA calculation")
trend_threshold = input.float(0.5, "Trend Threshold", minval=0.1, tooltip="Percentage threshold for trend signals")
// Enhanced Wavetrend
wt_channel_length = input.int(9, "WT Channel Length", minval=1, tooltip="Smoothing period for initial calculations")
wt_average_length = input.int(12, "WT Average Length", minval=1, tooltip="Smoothing period for final signal")
wt_ma_length = input.int(3, "WT MA Length", minval=1, tooltip="Moving average length for signal line")
wt_overbought = input.float(53, "WT Overbought", minval=0, tooltip="Level to identify overbought conditions")
wt_oversold = input.float(-53, "WT Oversold", minval=-100, tooltip="Level to identify oversold conditions")
// Risk Management
sl_percent = input.float(2.0, "Stop Loss %", minval=0.1, tooltip="Stop loss percentage from entry")
tp_percent = input.float(4.0, "Take Profit %", minval=0.1, tooltip="Take profit percentage from entry")
// =================== Indicator 1: Liquidity Weighted Supertrend ===================
// Volume-weighted component for dynamic sensitivity
vol_sma = ta.sma(volume, lwst_length)
vol_weight = volume / vol_sma
// ATR-based bands with volume weighting
atr = ta.atr(lwst_period)
upperBand = hl2 + lwst_multiplier * atr * vol_weight
lowerBand = hl2 - lwst_multiplier * atr * vol_weight
// Trend determination based on price action
var float lwst_trend = 0.0
lwst_trend := close > lwst_trend[1] ? 1 : close < lwst_trend[1] ? -1 : lwst_trend[1]
// =================== Indicator 2: Trend Signals ===================
// Dual EMA system for trend detection
fast_ema = ta.ema(close, trend_length)
slow_ema = ta.ema(close, trend_length * 2)
trend_diff = (fast_ema - slow_ema) / slow_ema * 100
trend_signal = trend_diff > trend_threshold ? 1 : trend_diff < -trend_threshold ? -1 : 0
// =================== Indicator 3: Enhanced Wavetrend ===================
// Calculate Wavetrend components
ap = hlc3 // Typical price
esa = ta.ema(ap, wt_channel_length) // Smoothed price
d = ta.ema(math.abs(ap - esa), wt_channel_length) // Average volatility
ci = (ap - esa) / (0.015 * d) // Base oscillator
tci = ta.ema(ci, wt_average_length) // Smoothed oscillator
// Generate main and signal lines
wt1 = tci
wt2 = ta.sma(wt1, wt_ma_length)
// Generate Wavetrend Signal based on overbought/oversold conditions
wt_signal = 0
wt_signal := wt1 > wt_overbought and wt2 > wt_overbought ? -1 :
wt1 < wt_oversold and wt2 < wt_oversold ? 1 :
wt_signal[1]
// =================== Consensus Signal Generation ===================
// Count bullish signals (1 point for each bullish indicator)
var int consensus_count = 0
consensus_count := (lwst_trend == 1 ? 1 : 0) +
(trend_signal == 1 ? 1 : 0) +
(wt_signal == 1 ? 1 : 0)
// Generate trading signals when majority (2+ indicators) agree
bool buy_signal = consensus_count >= 2
bool sell_signal = consensus_count <= -2
// =================== Trade Execution ===================
// Long position entry and exit with risk management
if (buy_signal and strategy.position_size <= 0)
strategy.entry("Long", strategy.long)
strategy.exit("Long TP/SL", "Long",
profit = close * tp_percent / 100,
loss = close * sl_percent / 100)
// Short position entry and exit with risk management
if (sell_signal and strategy.position_size >= 0)
strategy.entry("Short", strategy.short)
strategy.exit("Short TP/SL", "Short",
profit = close * tp_percent / 100,
loss = close * sl_percent / 100)
// =================== Visualization ===================
// Signal markers for entry points
plotshape(buy_signal ? low : na, "Buy Signal", shape.triangleup, location.belowbar, color.green, size=size.small)
plotshape(sell_signal ? high : na, "Sell Signal", shape.triangledown, location.abovebar, color.red, size=size.small)
// Indicator lines
plot(wt1, "Wavetrend 1", color.blue, linewidth=1)
plot(wt2, "Wavetrend 2", color.orange, linewidth=1)
plot(wt_overbought, "Overbought", color.red, linewidth=1)
plot(wt_oversold, "Oversold", color.green, linewidth=1)
plot(fast_ema, "Fast EMA", color.yellow, linewidth=1)
plot(slow_ema, "Slow EMA", color.white, linewidth=1)
plot(lwst_trend == 1 ? upperBand : na, "Upper Band", color.green, linewidth=2)
plot(lwst_trend == -1 ? lowerBand : na, "Lower Band", color.red, linewidth=2)
// =================== Information Table ===================
// Real-time display of indicator signals
var table info = table.new(position.top_right, 2, 4)
table.cell(info, 0, 0, "Indicator", bgcolor=color.gray, text_color=color.white)
table.cell(info, 1, 0, "Signal", bgcolor=color.gray, text_color=color.white)
table.cell(info, 0, 1, "LWST", text_color=color.white)
table.cell(info, 1, 1, str.tostring(lwst_trend), text_color=lwst_trend == 1 ? color.green : color.red)
table.cell(info, 0, 2, "Trend", text_color=color.white)
table.cell(info, 1, 2, str.tostring(trend_signal), text_color=trend_signal == 1 ? color.green : color.red)
table.cell(info, 0, 3, "Wavetrend", text_color=color.white)
table.cell(info, 1, 3, str.tostring(wt_signal), text_color=wt_signal == 1 ? color.green : color.red)