
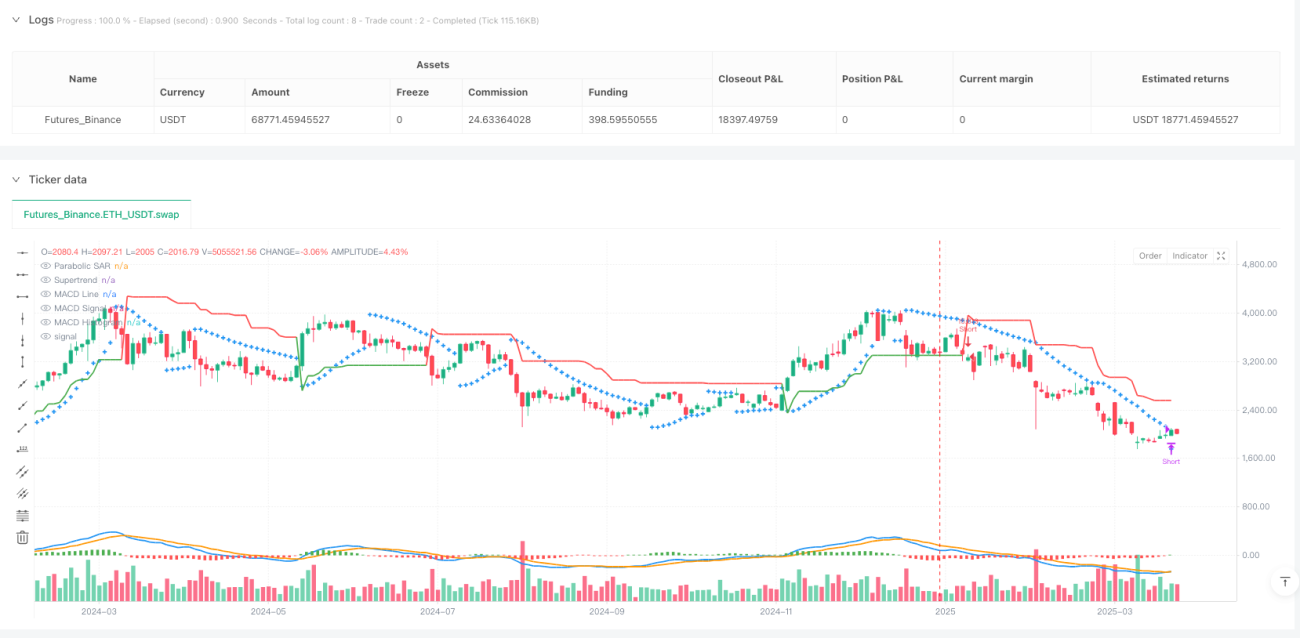
이 전략은 여러 기술적 지표 (MACD, Supertrend, Parabolic SAR) 를 통합하여 시장의 추세와 거래 신호를 식별하는 종합적인 수량 거래 방법이다. 이 전략은 다양한 시장 환경에 적응할 수 있는 유연하고 엄격한 거래 의사 결정 프레임워크를 제공하고자 한다.
이 전략은 세 가지 핵심 기술 지표의 동적인 조합을 기반으로 합니다.
전략은 다음과 같은 논리를 통해 거래 결정을 합니다.
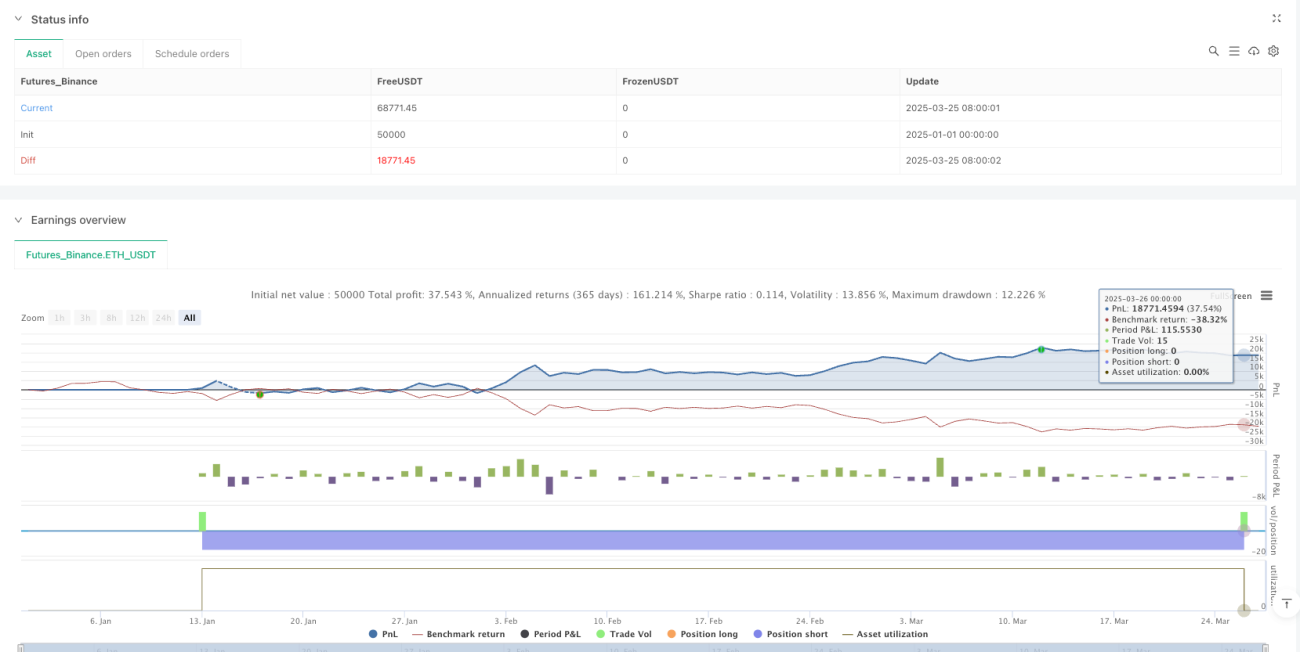
Vishal의 자율적 다중 지표 거래 전략은 MACD, Supertrend 및 Parabolic SAR의 연동 작용을 통해 포괄적이고 유연한 거래 의사 결정 프레임워크를 제공하는 혁신적인 양적 거래 방법이다. 여러 지표 검증 및 대칭 거래 논리는 위험이 있음에도 불구하고 투자자에게 깊이 연구 할 가치가있는 거래 모델을 제공합니다.
/*backtest
start: 2025-01-01 00:00:00
end: 2025-03-27 00:00:00
period: 2d
basePeriod: 2d
exchanges: [{"eid":"Futures_Binance","currency":"ETH_USDT"}]
*/
//@version=6
strategy("Vishal Strategy", overlay=true, margin_long=100, margin_short=100, initial_capital=100000, default_qty_type=strategy.percent_of_equity, default_qty_value=100)
// **MACD Inputs & Calculation**
fast_length = input.int(13, title="MACD Fast Length")
slow_length = input.int(27, title="MACD Slow Length")
signal_length = input.int(9, title="MACD Signal Smoothing")
fast_ma = ta.ema(close, fast_length)
slow_ma = ta.ema(close, slow_length)
macd = fast_ma - slow_ma
signal = ta.ema(macd, signal_length)
hist = macd - signal
// **Supertrend Inputs & Calculation**
atrPeriod = input.int(11, "ATR Length", minval = 1)
factor = input.float(3.0, "Factor", minval = 0.01, step = 0.01)
[supertrend, direction] = ta.supertrend(factor, atrPeriod)
bullTrend = direction < 0 // Uptrend Condition
bearTrend = direction > 0 // Downtrend Condition
// **Parabolic SAR Inputs & Calculation**
sarStep = input.float(0.02, "Parabolic SAR Step")
sarMax = input.float(0.2, "Parabolic SAR Max")
sar = ta.sar(sarStep, sarStep, sarMax)
// **Trade Entry Conditions**
macdBullish = macd > signal // MACD in Bullish Mode
macdBearish = macd < signal // MACD in Bearish Mode
priceAboveSAR = close > sar // Price above SAR (Bullish)
priceBelowSAR = close < sar // Price below SAR (Bearish)
// **Boolean Flags to Track Conditions Being Met**
var bool macdConditionMet = false
var bool sarConditionMet = false
var bool trendConditionMet = false
// **Track if Each Condition is Met in Any Order**
if (macdBullish)
macdConditionMet := true
if (macdBearish)
macdConditionMet := false
if (priceAboveSAR)
sarConditionMet := true
if (priceBelowSAR)
sarConditionMet := false
if (bullTrend)
trendConditionMet := true
if (bearTrend)
trendConditionMet := false
// **Final Long Entry Signal (Triggers When All Three Flags Are True)**
longSignal = macdConditionMet and sarConditionMet and trendConditionMet
// **Final Short Entry Signal (Triggers When All Three Flags Are False)**
shortSignal = not macdConditionMet and not sarConditionMet and not trendConditionMet
// **Execute Full Equity Trades**
if (longSignal)
strategy.entry("Long", strategy.long)
if (shortSignal)
strategy.entry("Short", strategy.short)
// **Exit Logic - Requires 2 Consecutive Candle Closes Below/Above SAR**
var int belowSARCount = 0
var int aboveSARCount = 0
if (strategy.position_size > 0) // Long position is active
belowSARCount := close < sar ? belowSARCount + 1 : 0
if (belowSARCount >= 1)
strategy.close("Long")
if (strategy.position_size < 0) // Short position is active
aboveSARCount := close > sar ? aboveSARCount + 1 : 0
if (aboveSARCount >= 1)
strategy.close("Short")
// **Plot Indicators**
plot(supertrend, title="Supertrend", color=bullTrend ? color.green : color.red, linewidth=2, style=plot.style_linebr)
plot(sar, title="Parabolic SAR", color=color.blue, style=plot.style_cross, linewidth=2)
plot(macd, title="MACD Line", color=color.blue, linewidth=2)
plot(signal, title="MACD Signal", color=color.orange, linewidth=2)
plot(hist, title="MACD Histogram", style=plot.style_columns, color=hist >= 0 ? color.green : color.red)