다차원 기술 지표 복합 추세 추적 양적 거래 전략

EMA RSI ATR VWAP ST
생성 날짜: 2025-03-28 17:22:09 마지막으로 수정됨: 2025-03-28 17:22:09
복사: 0 클릭수: 357
avatar of ianzeng123 ianzeng123
2
집중하다
319
수행원

다차원 기술 지표 복합 추세 추적 양적 거래 전략 다차원 기술 지표 복합 추세 추적 양적 거래 전략

개요

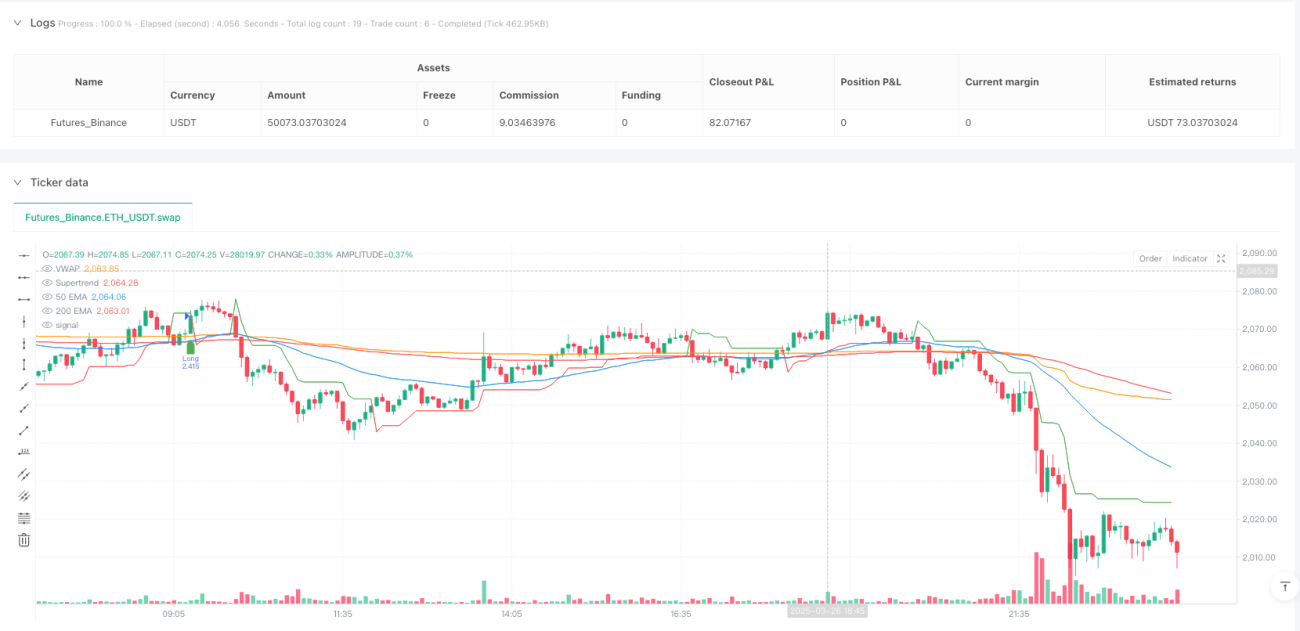
이 전략은 여러 기술 지표들을 종합적으로 사용하는 양적 거래 방법이며, 지수 이동 평균 (EMA), 상대적으로 강한 지수 (RSI), 평균 실제 변동 범위 (ATR), 거래량 가중 평균 가격 (VWAP) 및 슈퍼 트렌드 (Supertrend) 등의 지표를 결합하여 시장 추세를 정확하게 포착하고 위험을 통제 할 수 있는 거래를 구현하기 위해 고안되었습니다.

전략 원칙

전략의 핵심은 다차원 기술 지표의 상호 작용에 기반합니다.

  1. 50일 및 200일 지수 이동 평균 (EMA) 을 사용하여 트렌드 방향과 가능한 트렌드 역점을 판단
  2. 상대적으로 약한 지수 (RSI) 를 통해 트렌드 동력을 확인하고 지나치게 상승하거나 하락하는 것을 피하십시오.
  3. 평균 실제 변동 범위 ((ATR) 를 사용하여 동적 스톱로스 및 스톱 거리 계산
  4. 합성 거래량 가중 평균 가격 ((VWAP)) 검증된 가격 움직임의 지원 및 압박 지점
  5. 슈퍼 트렌드 (Supertrend) 지표가 트렌드 방향을 확인하고 거래 신호를 사용합니다.

전략적 이점

  1. 다중 지표 연동: 여러 기술 지표를 통합하여 신호의 정확성과 신뢰성을 크게 향상시킵니다.
  2. 위험 관리: 동적 ATR 중지 및 고정 위험 수익률, 단일 거래 위험을 효과적으로 제어
  3. 유연성: 시장의 변화에 따라 다양한 변수를 조정할 수 있습니다.
  4. 신호 필터링: RSI 및 VWAP와 같은 지표를 통해 불확정 신호를 필터링하여 잘못된 거래를 줄인다.
  5. 실시간성: 실시간 거래 신호와 경보를 생성하여 거래자가 시장 변화에 신속하게 대응할 수 있습니다.

전략적 위험

  1. 매개 변수 민감성: 지표 매개 변수 설정이 잘못되면 거래 신호가 자주 발생하거나 신호가 누락될 수 있습니다.
  2. 시장의 급격한 변화: 블랙 스 사건과 시장의 급격한 변동이 완전히 피할 수 없습니다.
  3. 과도한 적합성 위험: 전략 변수를 충분히 재검토하고 검증해야 합니다.
  4. 거래 비용: 거래 빈도는 수수료와 슬라이드 포인트 비용을 증가시킬 수 있습니다.
  5. 지표의 실패: 특정 시장 단계에서 일부 기술 지표는 예측 효과를 잃을 수 있습니다.

전략 최적화 방향

  1. 기계 학습 알고리즘 도입: AI 기술을 사용하여 지표 변수를 동적으로 조정
  2. 더 많은 필터링 조건을 추가: 변동성, 거래량과 같은 추가 지표 도입
  3. 다중 주기 분석 모듈 개발: 다른 시간 스케일에서 거래 신호를 검증
  4. 리스크 관리를 최적화: 더 복잡한 포지션 관리와 자금 관리 전략을 도입
  5. 적응 변수를 증가: 시장의 변동성에 따라 자동으로 중지 및 중지 전략을 조정

요약하다

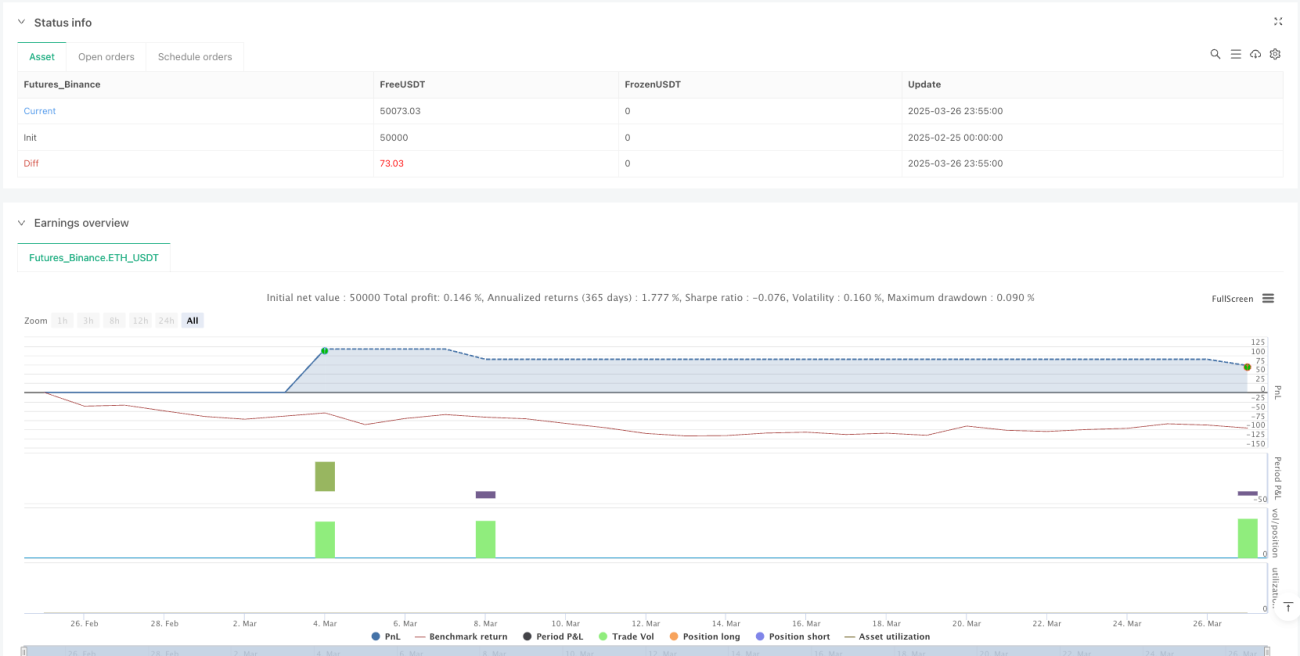
이것은 다차원 기술 지표를 기반으로 한 양적 거래 전략이며, 체계적인 지표 포트폴리오와 엄격한 위험 관리를 통해 시장 추세를 포착하고 거래 위험을 제어하는 것을 목표로합니다. 전략의 핵심은 지표의 연동 작용과 동적 파라미터 최적화에 있으며, 양적 거래에 대한 유연하고 상대적으로 안정적인 방법을 제공합니다.

전략 소스 코드
/*backtest
start: 2025-02-25 00:00:00
end: 2025-03-27 00:00:00
period: 5m
basePeriod: 5m
exchanges: [{"eid":"Futures_Binance","currency":"ETH_USDT"}]
*/

//@version=6
strategy("Advanced BTC/USDT Strategy", overlay=true, default_qty_type=strategy.percent_of_equity, default_qty_value=10)

// ==== INPUT PARAMETERS ====
emaShortLength = input.int(50, title="Short EMA Length")
emaLongLength = input.int(200, title="Long EMA Length")
rsiLength = input.int(14, title="RSI Length")
atrLength = input.int(14, title="ATR Length")
supertrendFactor = input.float(2.0, title="Supertrend Factor")
supertrendATRLength = input.int(10, title="Supertrend ATR Length")
riskRewardRatio = input.float(2.0, title="Risk-Reward Ratio")

// ==== TECHNICAL INDICATORS ====
// Exponential Moving Averages (EMA)
emaShort = ta.ema(close, emaShortLength)
emaLong = ta.ema(close, emaLongLength)

// Relative Strength Index (RSI)
rsi = ta.rsi(close, rsiLength)

// Supertrend Indicator
[supertrend, supertrendDirection] = ta.supertrend(supertrendFactor, supertrendATRLength)

// Average True Range (ATR) for Stop Loss Calculation
atr = ta.atr(atrLength)
stopLossDistance = atr * 1.5  // ATR-based stop-loss
takeProfitDistance = stopLossDistance * riskRewardRatio

// Volume Weighted Average Price (VWAP)
vwap = ta.vwap(close)

// ==== ENTRY CONDITIONS ====
// Long Entry: Golden Cross + RSI Confirmation + VWAP Support + Supertrend Uptrend
longCondition = ta.crossover(emaShort, emaLong) and rsi > 40 and rsi < 65 and close > vwap and supertrendDirection == 1

// Short Entry: Death Cross + RSI Confirmation + VWAP Resistance + Supertrend Downtrend
shortCondition = ta.crossunder(emaShort, emaLong) and rsi > 60 and rsi < 80 and close < vwap and supertrendDirection == -1

// ==== EXIT CONDITIONS ====
// Stop-Loss and Take-Profit Levels for Long Positions
longStopLoss = close - stopLossDistance
longTakeProfit = close + takeProfitDistance

// Stop-Loss and Take-Profit Levels for Short Positions
shortStopLoss = close + stopLossDistance
shortTakeProfit = close - takeProfitDistance

// ==== TRADE EXECUTION ====
// Open Long Trade
if (longCondition)
    strategy.entry("Long", strategy.long)
    strategy.exit("Long Exit", from_entry="Long", limit=longTakeProfit, stop=longStopLoss)

// Open Short Trade
if (shortCondition)
    strategy.entry("Short", strategy.short)
    strategy.exit("Short Exit", from_entry="Short", limit=shortTakeProfit, stop=shortStopLoss)

// ==== ALERT SYSTEM (OPTIONAL) ====
// Send real-time alerts for buy/sell signals
alertcondition(longCondition, title="BUY Alert 🚀", message="BTC Buy Signal! 📈")
alertcondition(shortCondition, title="SELL Alert 🔻", message="BTC Sell Signal! 📉")

// ==== PLOTTING ====
// Plot Moving Averages
plot(emaShort, color=color.blue, title="50 EMA")
plot(emaLong, color=color.red, title="200 EMA")

// Plot Supertrend
plot(supertrend, color=supertrendDirection == 1 ? color.green : color.red, title="Supertrend")

// Plot VWAP
plot(vwap, color=color.orange, title="VWAP")

// Plot Buy/Sell Signals
plotshape(series=longCondition, location=location.belowbar, color=color.green, style=shape.labelup, title="Buy Signal")
plotshape(series=shortCondition, location=location.abovebar, color=color.red, style=shape.labeldown, title="Sell Signal")