다차원적 동적 추세 추적 및 양적 거래 전략

ATR RSI EMA SL TP
생성 날짜: 2025-03-28 17:31:28 마지막으로 수정됨: 2025-03-28 17:31:28
복사: 3 클릭수: 356
avatar of ianzeng123 ianzeng123
2
집중하다
319
수행원

다차원적 동적 추세 추적 및 양적 거래 전략 다차원적 동적 추세 추적 및 양적 거래 전략

개요

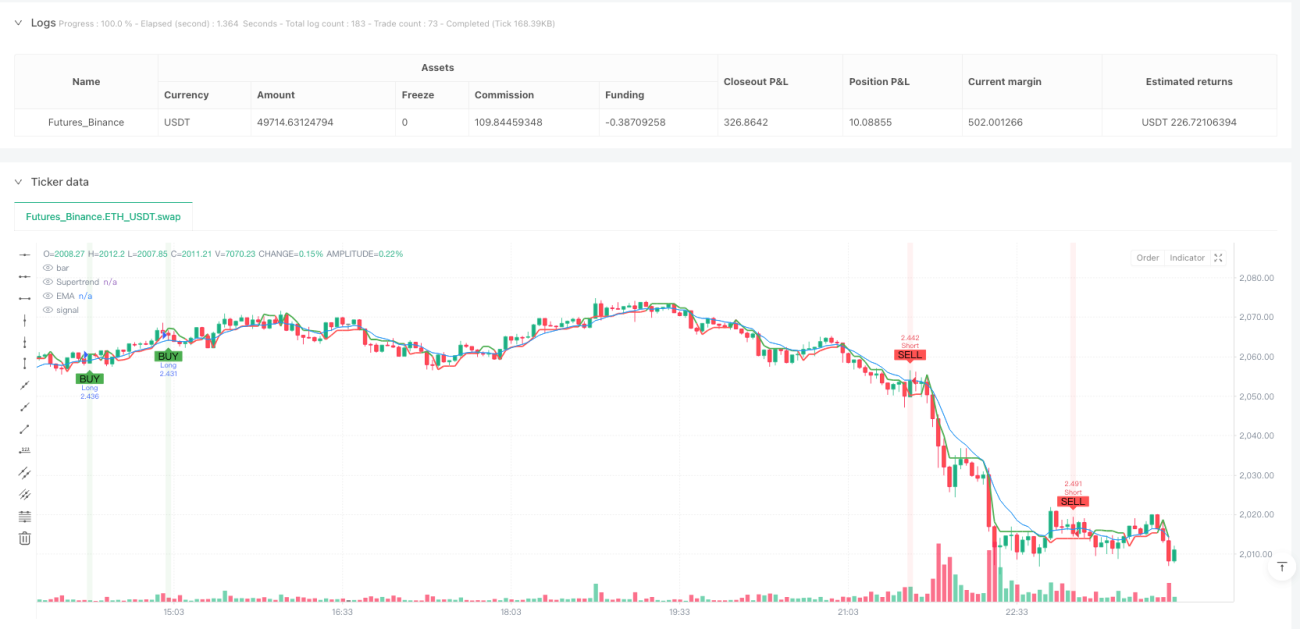
이 전략은 슈퍼 트렌드 (Supertrend), 지수 이동 평균 (EMA) 및 상대적으로 약한 지수 (RSI) 를 결합하여 정밀한 거래 신호 캡처 및 위험 관리에 초점을 맞춘 혁신적인 양적 거래 방법입니다. 이 전략은 거래자에게 1 분, 5 분 및 15 분 차트에 유연하게 적용 가능한 동적, 다차원 시장 추세를 추적하는 장치를 제공하고자합니다.

전략 원칙

이 전략의 핵심은 세 가지 핵심 기술 지표의 상호 작용에 기반합니다.

  1. 슈퍼 트렌드 (Supertrend): 평균 실제 변동 범위 (ATR) 와 가격 변화 방향을 계산하여 시장 추세를 판단합니다.
  2. 지수 이동 평균 ((EMA): 동적인 지지/저항 선으로, 가격의 상대 평균의 위치를 결정하는데 도움을 준다.
  3. 상대적으로 약한 지수 (RSI): 시장의 동력을 평가하고, 과매매 및 과매매 상황을 식별한다.

이 전략은 다음과 같은 세 가지 지표의 통합 분석을 통해 거래 신호를 생성합니다.

  • 더 많은 신호: 슈퍼 트렌드는 더 많은 + 가격이 EMA보다 높습니다 + RSI가 40보다 높습니다
  • 공백 신호: 슈퍼 트렌드는 공백 + 가격은 EMA보다 낮습니다 + RSI는 60보다 낮습니다

전략적 이점

  1. 다차원 신호 검증: 세 가지 지표의 교차 검증을 통해 신호의 신뢰성을 크게 향상시킨다.
  2. 동적 위험 관리: ATR 기반의 중지 및 중지 메커니즘을 사용하여 시장의 변동에 적응 할 수 있습니다.
  3. 융통성: 여러 시간 주기에서 사용할 수 있다.
  4. 단일 포지션 제어: 한 번에 하나의 포지션만 허용하여 거래 위험을 효과적으로 제어한다.
  5. 시각적 도움말: 명확한 구매/판매 신호 표시와 핵심 지표 표를 제공합니다.

전략적 위험

  1. 지표 지연성: 기술 지표에는 특정 역사 데이터 의존성이 있으며, 신호 지연을 초래할 수 있다.
  2. 변동율의 영향: 높은 변동률의 시장에서, 정지 손실은 자주 유발될 수 있다.
  3. 매개 변수 민감성: ATR 길이, EMA 주기 및 RSI 하락값이 전략 성능에 중요한 영향을 미칩니다.
  4. 거래 비용: 자주 거래하면 높은 수수료가 발생할 수 있습니다.

전략 최적화 방향

  1. 자기 적응 파라미터: 기계 학습 알고리즘을 도입하여 시장 조건에 따라 파라미터를 동적으로 조정한다.
  2. 다공간 포트폴리: 트렌드 추적과 반전 전략을 결합하여, 전략의 안정성을 균형 잡는다.
  3. 위험 분배: 포지션 관리를 최적화하고, 동적 포지션 크기를 제어한다.
  4. 다중주기 검증: 더 많은 시간주기의 신호 검증 메커니즘.
  5. 거래 비용 최적화: 거래 빈도를 낮추고 불필요한 거래를 줄여줍니다.

요약하다

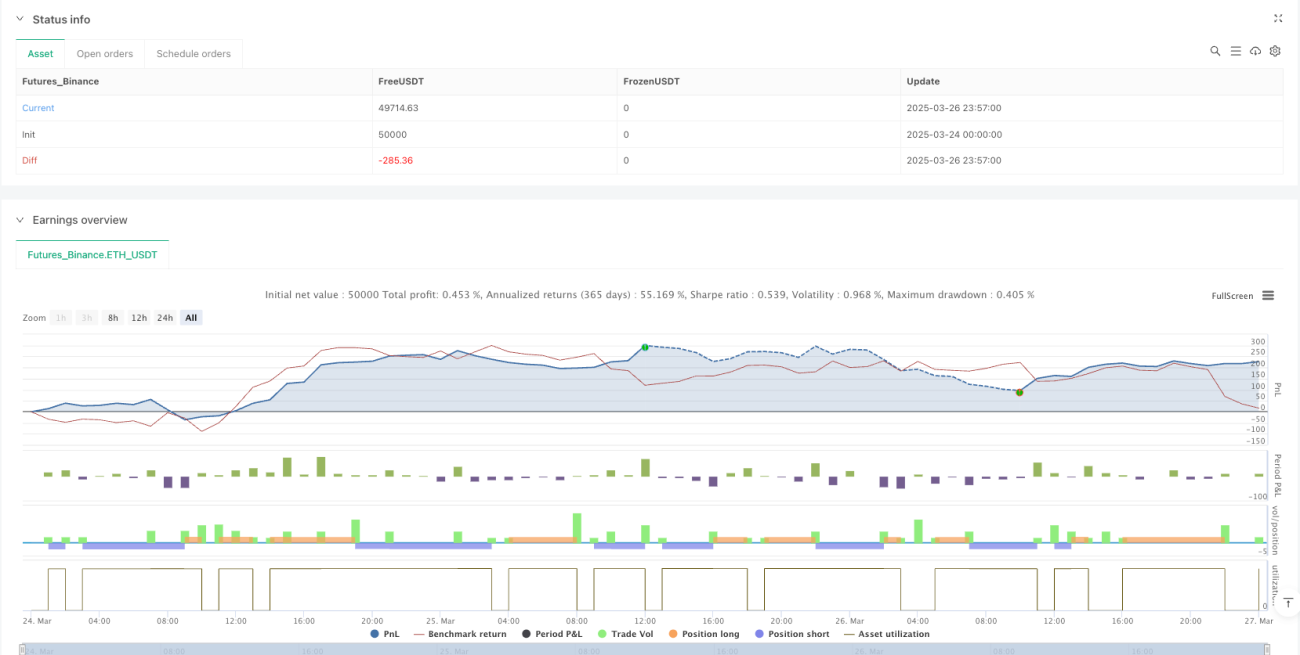
이것은 다차원 기술 분석을 결합한 정량 거래 전략이며, 슈퍼 트렌드, EMA 및 RSI의 연동 작용을 통해 거래자에게 동적이고 유연한 거래 의사 결정 프레임 워크를 제공합니다. 전략의 핵심 장점은 다중 신호 검증과 적응 위험 관리 메커니즘이지만, 거래자가 지속적으로 최적화하고 조정해야합니다.

전략 소스 코드
/*backtest
start: 2025-03-24 00:00:00
end: 2025-03-27 00:00:00
period: 3m
basePeriod: 3m
exchanges: [{"eid":"Futures_Binance","currency":"ETH_USDT"}]
*/

//@version=6
strategy("SOL Scalper - Supertrend + EMA + RSI (One Position at a Time)", overlay=true, initial_capital=1000, default_qty_type=strategy.percent_of_equity, default_qty_value=10, commission_type=strategy.commission.percent, commission_value=0.075)

// Inputs
atrLength = input.int(7, title="ATR Length", minval=1)
atrMultiplier = input.float(0.8, title="ATR Multiplier", minval=0.1)
emaLength = input.int(9, title="EMA Length", minval=1)
rsiLength = input.int(14, title="RSI Length", minval=1)
slPercent = input.float(1, title="Stop Loss (%)", minval=0.1, step=0.1) / 100
tpMultiplier = input.float(3.0, title="Take Profit Multiplier", minval=1.0)

// Supertrend Calculation
atr = ta.atr(atrLength)
[supertrend, direction] = ta.supertrend(atrMultiplier, atrLength)
plot(supertrend, color=direction == 1 ? color.green : color.red, linewidth=2, title="Supertrend")

// EMA Calculation
ema = ta.ema(close, emaLength)
plot(ema, color=color.blue, title="EMA")

// RSI Calculation
rsi = ta.rsi(close, rsiLength)
rsiOverbought = 60 // Adjusted to allow more trades
rsiOversold = 40  // Adjusted to allow more trades

// Entry Conditions
longCondition = direction == 1 and close > ema and rsi > rsiOversold
shortCondition = direction == -1 and close < ema and rsi < rsiOverbought

// Risk Management
stopLoss = close * slPercent
takeProfit = atr * tpMultiplier

// Ensure Only One Position at a Time
var bool inPosition = false

// Execute Trades
if (not inPosition) // Only enter a new trade if no position is open
    if (longCondition)
        strategy.entry("Long", strategy.long)
        strategy.exit("Long Exit", "Long", stop=close - stopLoss, limit=close + takeProfit)
        inPosition := true // Set inPosition to true when a trade is opened

    if (shortCondition)
        strategy.entry("Short", strategy.short)
        strategy.exit("Short Exit", "Short", stop=close + stopLoss, limit=close - takeProfit)
        inPosition := true // Set inPosition to true when a trade is opened

// Reset inPosition when the trade is closed
if (strategy.position_size == 0)
    inPosition := false

// Visuals
plotshape(series=longCondition and not inPosition, title="Buy Signal", location=location.belowbar, color=color.green, style=shape.labelup, text="BUY")
plotshape(series=shortCondition and not inPosition, title="Sell Signal", location=location.abovebar, color=color.red, style=shape.labeldown, text="SELL")

// Debugging
bgcolor(longCondition and not inPosition ? color.new(color.green, 90) : na, title="Long Condition")
bgcolor(shortCondition and not inPosition ? color.new(color.red, 90) : na, title="Short Condition")

// Key Metrics Table
var table keyMetrics = table.new(position.top_right, 2, 4, border_width=1)
if barstate.islast
    table.cell(keyMetrics, 0, 0, "ATR", bgcolor=color.gray)
    table.cell(keyMetrics, 1, 0, str.tostring(atr, "#.#####"), bgcolor=color.gray)
    table.cell(keyMetrics, 0, 1, "RSI", bgcolor=color.gray)
    table.cell(keyMetrics, 1, 1, str.tostring(rsi, "#.##"), bgcolor=color.gray)
    table.cell(keyMetrics, 0, 2, "Trend", bgcolor=color.gray)
    table.cell(keyMetrics, 1, 2, direction == 1 ? "Bullish" : "Bearish", bgcolor=color.gray)
    table.cell(keyMetrics, 0, 3, "TP Distance", bgcolor=color.gray)
    table.cell(keyMetrics, 1, 3, str.tostring(takeProfit, "#.#####"), bgcolor=color.gray)