
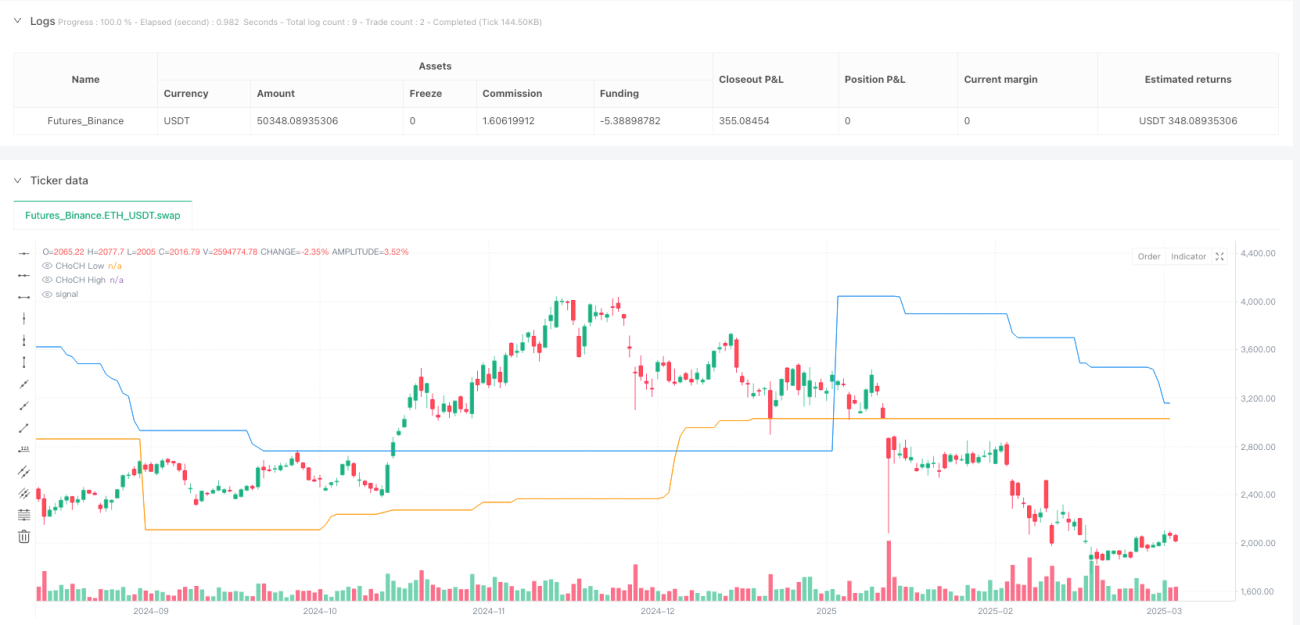
시장 구조 스윙 트레이딩 전략은 시장 구조의 변화, 유동성 캡처 및 트렌드 동력을 기반으로 한 고급 거래 방법이다. 이 전략은 가격 변화의 주요 특징을 분석하여 잠재적인 트렌드 반전 및 지속 기회를 식별하여 거래자에게 체계화된 거래 의사 결정 프레임 워크를 제공합니다.
이 전략의 핵심은 다음과 같은 네 가지 핵심 지표에 기반합니다.
전략은 평균 실제 변동 범위 (ATR), 상대 강도 (RSI) 및 거래량을 포함한 기술 분석 지표를 종합적으로 사용하여 다차원 거래 의사 결정 시스템을 구축합니다.
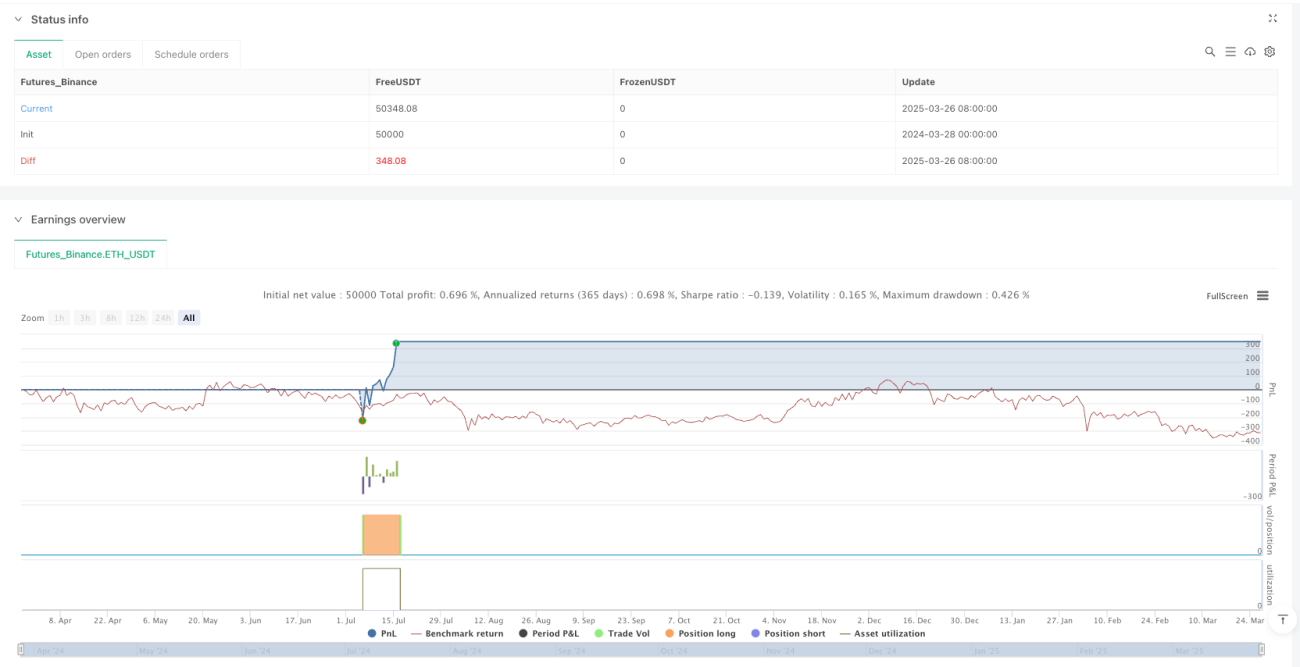
시장 구조 스윙 거래 전략은 체계화된 시장 구조 분석을 통해 거래자에게 강력한 거래 의사 결정 프레임 워크를 제공하는 첨단 양적 거래 방법입니다. 지속적인 최적화 및 위험 관리를 통해 이 전략은 다양한 시장 환경에서 안정적인 거래 성능을 얻을 수 있습니다.
/*backtest
start: 2024-03-28 00:00:00
end: 2025-03-27 00:00:00
period: 1d
basePeriod: 1d
exchanges: [{"eid":"Futures_Binance","currency":"ETH_USDT"}]
*/
//@version=5
strategy("Market Structure Swing Trading", overlay=true, default_qty_type=strategy.percent_of_equity, default_qty_value=5)
// === Input Parameters ===
len = input(50, "CHoCH Detection Period")
shortLen = input(3, "IDM Detection Period")
atrMultiplierSL = input(2.0, "ATR Multiplier for Stop Loss")
atrMultiplierTP = input(3.0, "ATR Multiplier for Take Profit")
rsiPeriod = input(14, "RSI Period")
rsiOverbought = input(70, "RSI Overbought Level")
rsiOversold = input(30, "RSI Oversold Level")
volThreshold = input(1.2, "Volume Multiplier Threshold")
// === ATR Calculation for SL & TP ===
atr = ta.atr(14)
stopLossLong = close - (atr * atrMultiplierSL)
takeProfitLong = close + (atr * atrMultiplierTP)
stopLossShort = close + (atr * atrMultiplierSL)
takeProfitShort = close - (atr * atrMultiplierTP)
// === RSI Filter ===
rsi = ta.rsi(close, rsiPeriod)
longConditionRSI = rsi < rsiOversold
shortConditionRSI = rsi > rsiOverbought
// === Volume Filter ===
volThresholdValue = ta.sma(volume, 20) * volThreshold
highVolume = volume > volThresholdValue
// === Market Structure Functions ===
swings(len) =>
var int topx = na
var int btmx = na
upper = ta.highest(len)
lower = ta.lowest(len)
top = high[len] > upper ? high[len] : na
btm = low[len] < lower ? low[len] : na
topx := top ? bar_index[len] : topx
btmx := btm ? bar_index[len] : btmx
[top, topx, btm, btmx]
[top, topx, btm, btmx] = swings(len)
// === CHoCH Detection ===
var float topy = na
var float btmy = na
var os = 0
var top_crossed = false
var btm_crossed = false
if top
topy := top
top_crossed := false
if btm
btmy := btm
btm_crossed := false
if close > topy and not top_crossed
os := 1
top_crossed := true
if close < btmy and not btm_crossed
os := 0
btm_crossed := true
// === Break of Structure (BOS) ===
var float max = na
var float min = na
var int max_x1 = na
var int min_x1 = na
if os != os[1]
max := high
min := low
max_x1 := bar_index
min_x1 := bar_index
bullishBOS = close > max and os == 1
bearishBOS = close < min and os == 0
// === Trade Conditions with Filters ===
longEntry = bullishBOS and longConditionRSI and highVolume
shortEntry = bearishBOS and shortConditionRSI and highVolume
// === Execute Trades ===
if longEntry
strategy.entry("Long", strategy.long)
strategy.exit("Long TP/SL", from_entry="Long", stop=stopLossLong, limit=takeProfitLong)
if shortEntry
strategy.entry("Short", strategy.short)
strategy.exit("Short TP/SL", from_entry="Short", stop=stopLossShort, limit=takeProfitShort)
// === Plotting Market Structure ===
plotshape(series=longEntry, location=location.belowbar, color=color.green, style=shape.labelup, title="BUY")
plotshape(series=shortEntry, location=location.abovebar, color=color.red, style=shape.labeldown, title="SELL")
plot(topy, color=color.blue, title="CHoCH High")
plot(btmy, color=color.orange, title="CHoCH Low")