다이내믹 트렌드 모멘텀 브레이크아웃 전략

EMA RSI ATR SMA
생성 날짜: 2025-03-28 17:41:01 마지막으로 수정됨: 2025-03-28 17:41:01
복사: 0 클릭수: 443
avatar of ianzeng123 ianzeng123
2
집중하다
319
수행원

다이내믹 트렌드 모멘텀 브레이크아웃 전략 다이내믹 트렌드 모멘텀 브레이크아웃 전략

개요

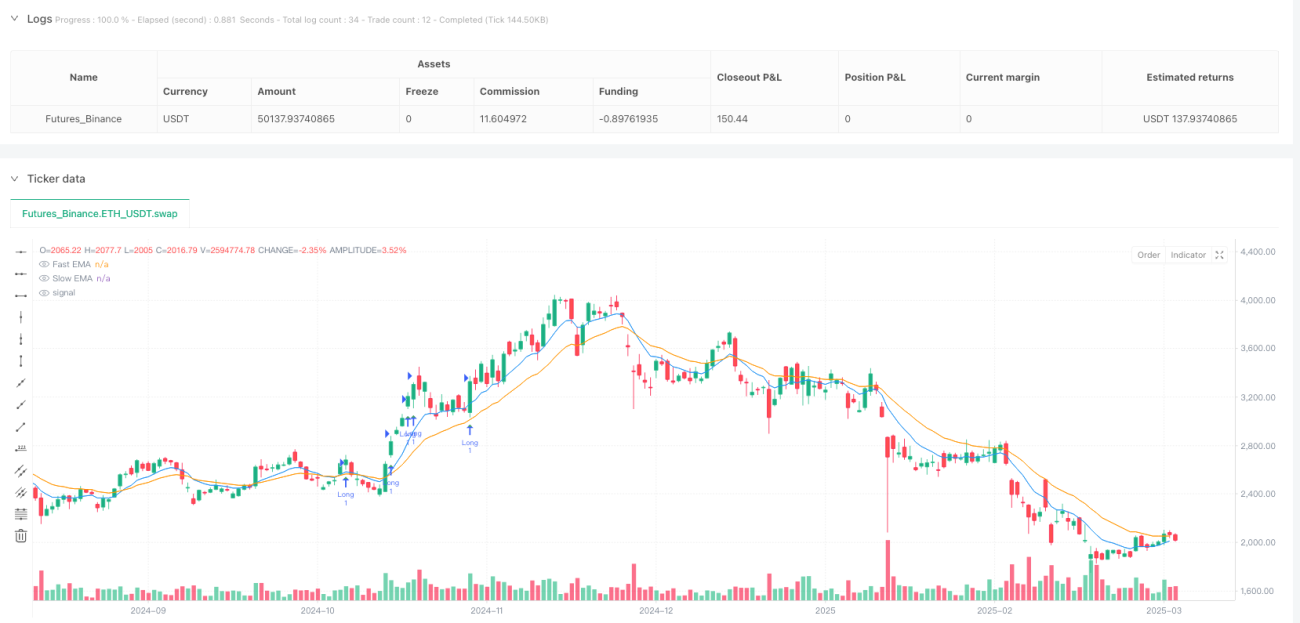
역동적인 트렌드 동적 돌파 전략은 고동량 주식을 위해 특별히 설계된 전문적인 양적 거래 방법이다. 이 전략은 지수 이동 평균 ((EMA), 상대적으로 강한 지수 ((RSI) 필터링, 거래량 확인 및 평균 실제 변동 범위 ((ATR) 에 기반한 추적 스톱로드를 결합하여 강력한 시장 돌파구를 포착하는 동시에 가짜 신호를 피하는 것을 목표로 한다.

전략 원칙

이 전략의 핵심 원칙은 다차원 시장 신호 검증에 기반합니다.

  1. 빠른 EMA와 느린 EMA를 사용하여 전체 트렌드 방향을 판단합니다.
  2. RSI를 활용하여 동력을 평가하고 부정적인 변동을 피하십시오.
  3. 거래량을 통해 거래 신호를 확인합니다.
  4. ATR 동적 관리 중지 및 추적 중지 적용

전략적 이점

  1. 높은 정밀도 신호 필터링: 여러 조건 검증으로 잘못된 신호의 확률을 낮춘다
  2. 동적 위험 관리: ATR 기반의 손해제도 보호
  3. 동향을 따라가기: EMA 포트폴리오는 강세를 따라가면만 입점할 수 있다
  4. 동력 캡처: 거래 양과 RSI 필터링은 거래 품질을 보장합니다.

전략적 위험

  1. 시장의 급격한 변동으로 인해 중지 손실이 유발 될 수 있습니다.
  2. 시장이 흔들리는 상황에서 더 많은 무효 신호가 발생할 수 있습니다.
  3. 기술 지표에 지나치게 의존하면 중요한 기본 정보를 놓칠 수 있습니다.

전략 최적화 방향

  1. 매개변수 선택을 최적화하기 위한 머신 러닝 알고리즘 소개
  2. 시간 프레임에 대한 검증 메커니즘을 추가합니다.
  3. 더 복잡한 다중 요소 필터링 알고리즘 개발
  4. 감정 지표와 기본 데이터를 결합한 것입니다.

요약하다

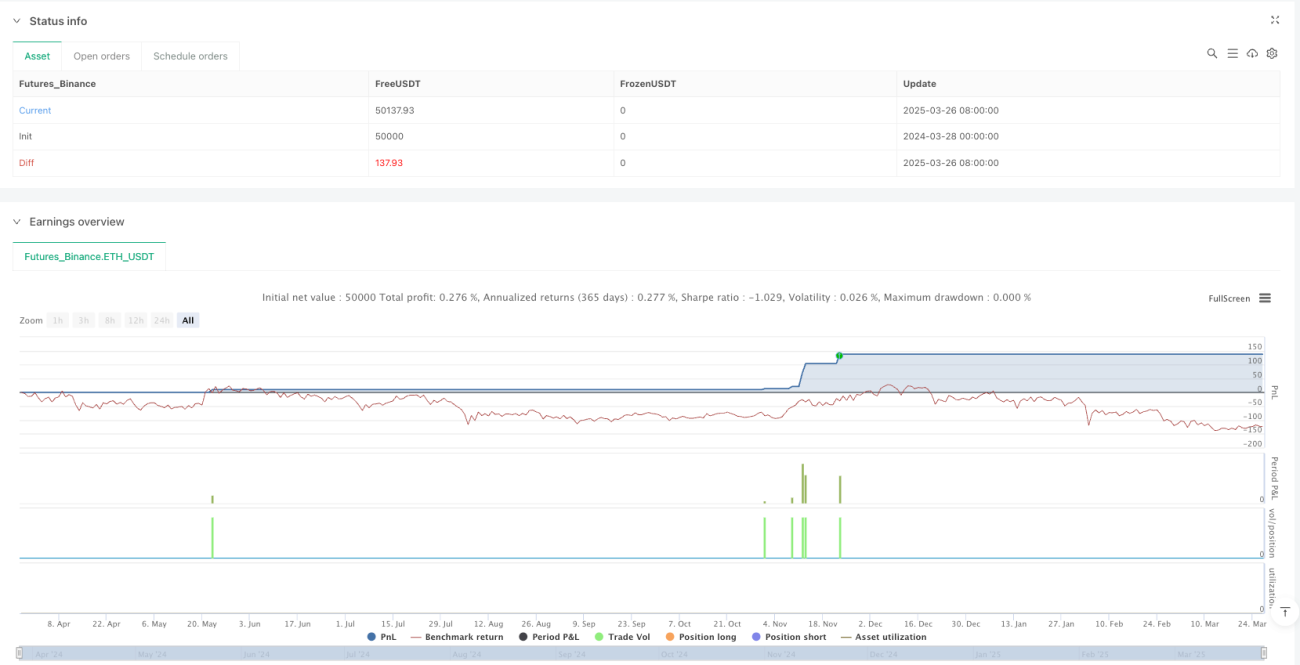
동적 트렌드 동적 돌파 전략은 여러 가지 기술적 분석 도구를 통합하여 비교적 안정적인 양적 거래 방법을 구축합니다. 그 핵심은 신호 포착 능력과 위험 제어의 균형을 맞추고 거래자에게 체계화된 거래 의사 결정 프레임 워크를 제공합니다.

전략 소스 코드
/*backtest
start: 2024-03-28 00:00:00
end: 2025-03-27 00:00:00
period: 1d
basePeriod: 1d
exchanges: [{"eid":"Futures_Binance","currency":"ETH_USDT"}]
*/

//@version=6
strategy("Enhanced First High Break Strategy v3", overlay=true, margin_long=100, margin_short=100)

// Input Parameters
emaFastLength = input.int(9, "Fast EMA Length")
emaSlowLength = input.int(20, "Slow EMA Length")
rsiLength = input.int(14, "RSI Length")
volumeAvgLength = input.int(20, "Volume Average Length")
atrLength = input.int(14, "ATR Length")

// Calculate Indicators
emaFast = ta.ema(close, emaFastLength)
emaSlow = ta.ema(close, emaSlowLength)
rsi = ta.rsi(close, rsiLength)
volAvg = ta.sma(volume, volumeAvgLength)
atr = ta.atr(atrLength)

// Pre-calculate lowest values (FIXED)
rsiLowCurrent = ta.lowest(rsi, 5)
rsiLowPrevious = ta.lowest(rsi[5], 5)
lowLowPrevious = ta.lowest(low[5], 5)

// Trend Conditions
bullishTrend = emaFast > emaSlow and emaFast > emaFast[1]
bearishDivergence = rsiLowCurrent > rsiLowPrevious and low < lowLowPrevious

// Entry Conditions
validBreakout = close > high[1] and close > emaFast
volumeConfirmation = volume > volAvg * 1.5
trendConfirmed = close > emaSlow and close[1] > emaSlow
rsiConfirmation = rsi > 50 and not bearishDivergence

// Final Entry Signal
entryCondition = validBreakout and volumeConfirmation and trendConfirmed

// Exit Conditions
stopLossPrice = low[1] - (atr * 0.50)
trailOffset = atr * 2

// Strategy Execution
if (entryCondition)
    strategy.entry("Long", strategy.long)
    strategy.exit("Exit", "Long", stop=stopLossPrice,trail_points=close > emaFast ? trailOffset : na,trail_offset=trailOffset)

// Plotting
plot(emaFast, "Fast EMA", color.new(color.blue, 0))
plot(emaSlow, "Slow EMA", color.new(color.orange, 0))
plotshape(entryCondition, style=shape.triangleup, color=color.green, location=location.belowbar)