
2
Follow
502
Followers
개요
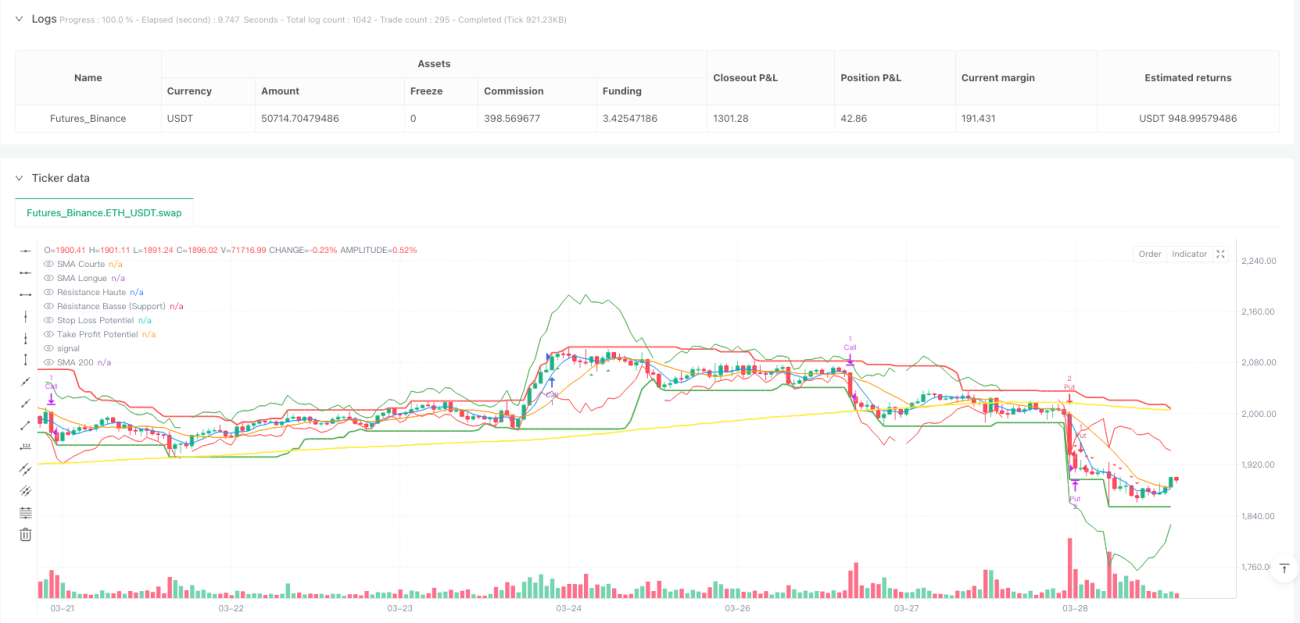
본 전략은 다차원 단기 추세 예측 전략으로, 여러 기술 지표의 시너지 효과를 활용하여 금융 시장의 단기 추세 변화를 식별하고 예측하는 데 중점을 둡니다. 이 전략은 단순 이동평균(SMA), 상대강도지수(RSI), 평균방향성지수(ADX), 평균진폭범위(ATR), 이동평균수렴확산지수(MACD) 및 스토캐스틱 오실레이터(Stochastic) 등 주요 기술적 분석 도구를 통합하여 거래 신호의 정확성과 신뢰성을 높이는 것을 목표로 합니다.
전략 원리
본 전략의 핵심 원리는 다중 기술 지표의 협력 분석과 추세 확인 메커니즘에 기반합니다. 다음 주요 요소를 종합적으로 고려하여 거래 신호를 생성합니다:
- 단기 및 장기 이동평균선의 교차
- RSI의 과매수/과매도 상태
- MACD 라인과 시그널 라인의 변화
- 스토캐스틱 오실레이터의 모멘텀 지표
- ADX 추세 강도
- 200주기 이동평균선의 전반적인 시장 추세
- 최근 시장 변동성
전략은 잠재적 진입점, 손절 및 이익 실현 수준을 동적으로 계산하고, 최근 시장 변동성에 따라 이러한 핵심 매개변수를 조정함으로써 위험 관리와 거래 실행을 구현합니다.
전략의 장점
- 다중 지표 종합 분석: 여러 기술 지표를 통합하여 단일 지표가 초래할 수 있는 오판 위험을 낮춤
- 동적 위험 관리: ATR 기반 손절 및 이익 실현 메커니즘으로 시장 변동성에 따라 포지션 조정
- 유연한 시간 프레임: 5분에서 4시간까지 다양한 거래 주기 지원
- 적응형 포지션 크기: 사용 가능한 자본과 거래당 위험 비율에 따라 포지션 크기를 동적으로 조정
- 추세 강도 확인: ADX 지표를 통해 추세 유효성을 확인하여 변동성 장에서 잦은 거래 방지
전략 위험
- 다중 지표 복잡성으로 인해 신호 생성이 지연될 수 있음
- 극도로 불안정한 시장 환경에서 지표가 상충하는 신호를 제공할 수 있음
- 백테스트 결과가 미래의 실제 거래 성과를 완전히 대표하지 않을 수 있음
- 레버리지 거래는 손실을 크게 확대할 수 있음
- 기본적 요소 및 갑작스러운 시장 이벤트를 고려하지 않음
전략 최적화 방향
- 머신러닝 알고리즘 도입으로 지표 가중치 동적 조정
- 더 많은 기본 및 감성 지표 추가
- 더 지능적인 포지션 관리 알고리즘 개발
- 다양한 시장 및 자산 유형에 맞춤형 매개변수 설정
- 실시간 뉴스 및 소셜 미디어 감성 분석 통합
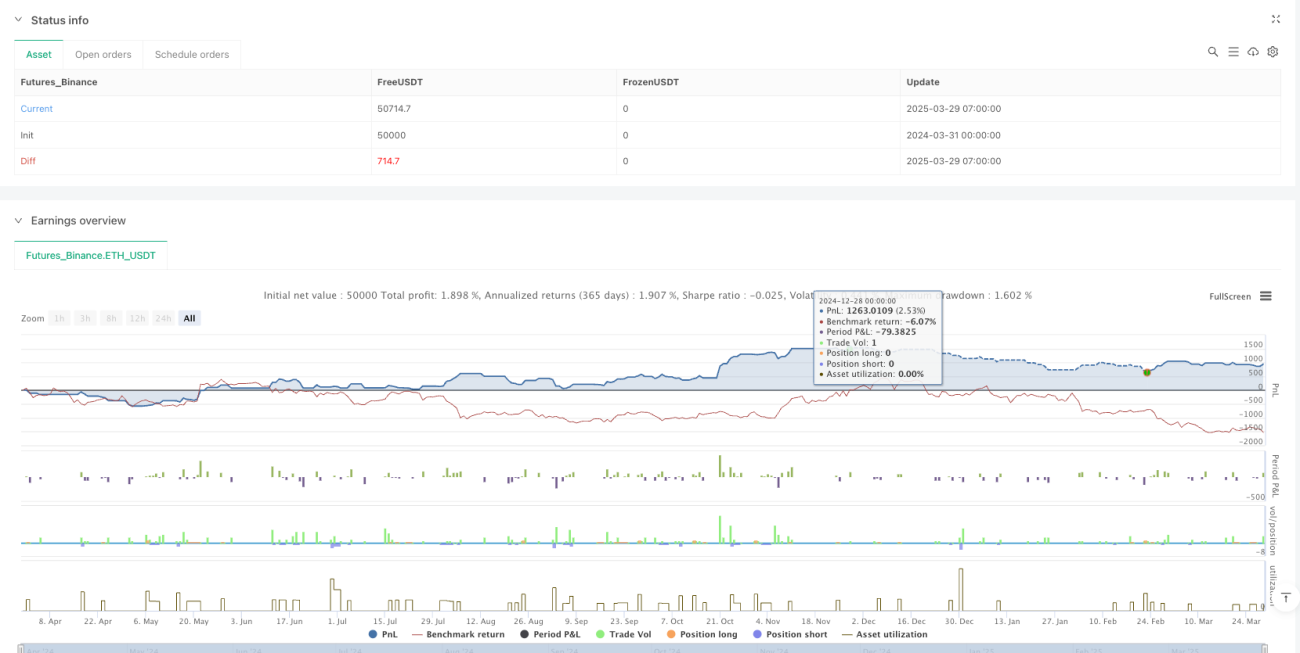
요약
본 전략은 다차원적이고 데이터 기반의 단기 추세 예측 전략으로, 복잡한 기술 지표 조합과 동적 위험 관리 메커니즘을 통해 거래 결정의 정확성과 신뢰성을 높이는 것을 목표로 합니다. 전략은 이론적으로 상당한 장점을 지니고 있지만, 실제 적용 시 신중함을 유지하고 지속적인 백테스트와 최적화가 필요합니다.
Source
Pine
Strategy parameters
Related strategies
Comment
All comments (0)
No data
- 1