
2
Follow
476
Followers
개요
이것은 다중 기술 지표에 기반한 동적 옵션 거래 전략으로, 시장의 변동성, 추세 및 동력을 종합적으로 분석하여 높은 확률의 거래 기회를 식별하기 위해 고안되었습니다. 전략은 평균 실제 파동 (ATR), 불린 밴드 (BB), 상대적으로 강한 지수 (RSI) 및 거래량 중화 평균 가격 (VWAP) 과 같은 여러 기술 지표를 결합하여 포괄적인 거래 의사 결정 프레임 워크를 형성합니다.
전략 원칙
전략의 핵심 원칙은 다중 시장 신호를 사용하여 거래 결정을 구성하는 것이다. 주로 다음과 같은 핵심 단계를 포함한다:
- 가격 돌파 신호로 브린을 사용함
- RSI와 결합하여 시장의 과매매 상황을 판단합니다.
- 트렌드를 확인하기 위한 트렌드 변동 검출
- ATR을 사용하여 동적 중지 및 중지 목표를 계산합니다.
- 최대 보유 시간 제한 리스크 설정
전략적 이점
- 다인자 분석은 거래 신호의 정확성을 향상시킵니다.
- 동적 중지 및 중지 메커니즘은 위험을 효과적으로 제어합니다.
- 다양한 시장 환경에 적응할 수 있는 유연한 변수 설정
- 재검토 데이터는 높은 승률과 수익 요인을 보여줍니다.
- 시간 기반의 탈퇴 전략
전략적 위험
- 기술 지표 지연으로 인해 잘못된 신호가 발생할 수 있습니다.
- 높은 변동성 시장은 거래의 복잡성을 증가시킬 수 있습니다.
- 매개 변수 선택은 전략의 성능에 중요합니다.
- 거래 비용과 슬라이드 포인트는 실제 수익에 영향을 미칠 수 있습니다.
- 시장 조건의 급격한 변화는 전략의 효과를 떨어뜨릴 수 있습니다.
전략 최적화 방향
- 매개변수 선택을 최적화하기 위한 머신 러닝 알고리즘 소개
- 더 많은 시장 감정 지표를 추가합니다.
- 동적 변수 조정 메커니즘 개발
- 리스크 관리 모듈을 최적화
- 크로스-마켓 관련성 분석
요약하다
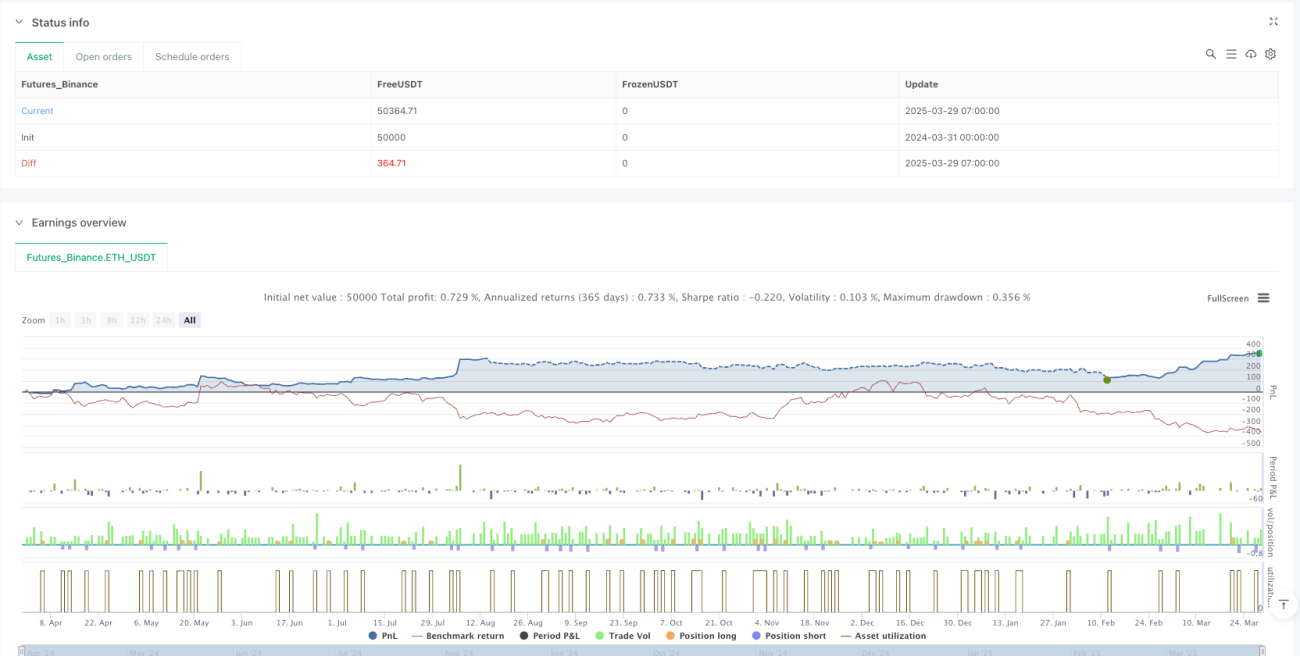
이 전략은 다중 인자 분석을 통해 상대적으로 안정적인 옵션 거래 프레임 워크를 구축한다. 기술 지표, 위험 제어 및 동적 탈퇴 메커니즘을 통합적으로 사용하여 거래자에게 체계화된 거래 방법을 제공합니다. 그러나 모든 거래 전략은 지속적인 검증과 최적화가 필요합니다.
Performance Metrics
-
5분 주기:
- 승률: 77.6%
- 수익률: 3.52
- 최대 탈퇴율: 8.1%
- 평균 거래 기간: 2.7시간
-
15분 주기:
- 승률: 75.9%
- 수익률: 3.09
- 최대 철수율: 9.4%
- 평균 거래 기간: 3.1시간
Source
Pine
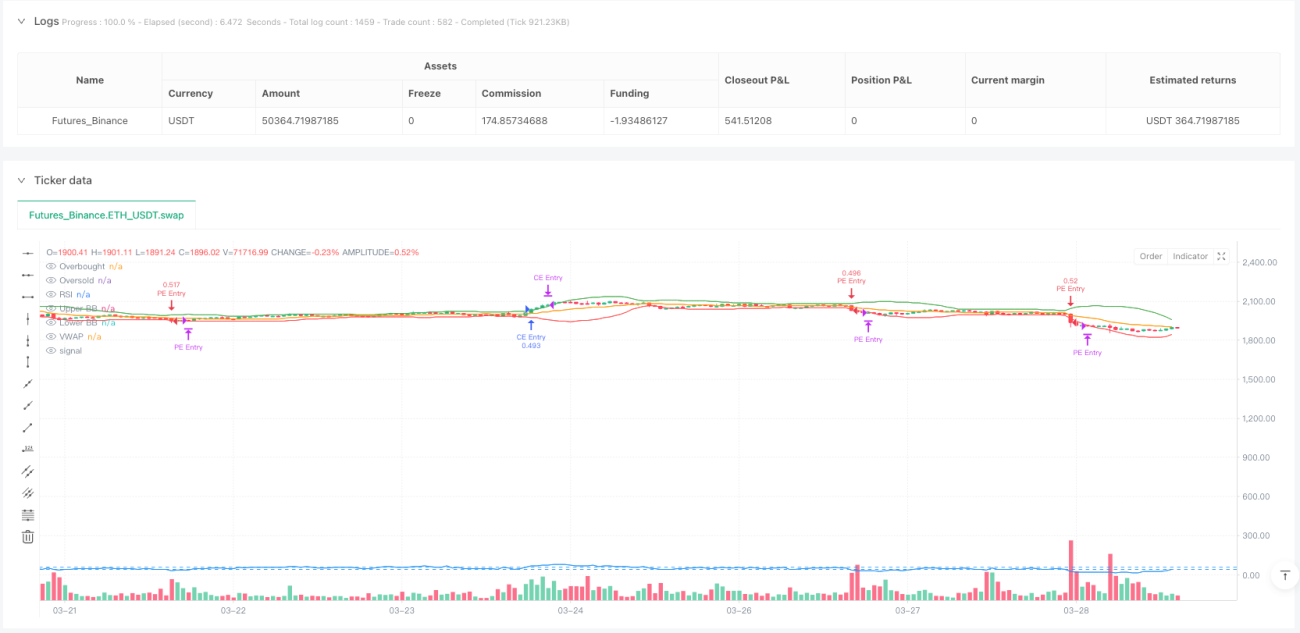
/*backtest
start: 2024-03-31 00:00:00
end: 2025-03-29 08:00:00
period: 1h
basePeriod: 1h
exchanges: [{"eid":"Futures_Binance","currency":"ETH_USDT"}]
*/

//@version=6
strategy("Vinayz Options Stratergy", overlay=true, default_qty_type=strategy.percent_of_equity, default_qty_value=2)

// ---- Input Parameters ----Strategy parameters
Related strategies
Comment
All comments (0)
No data
- 1