개요
이것은 유동성 구역 입점, ATR 변동적 하락, 그리고 동적 위험 관리를 통합하여 거래자에게 구조화된 거래 방법을 제공하는 혁신적인 양적 거래 전략입니다. 이 전략은 높은 확률의 거래 기회를 식별하고 자동으로 스톱 및 스톱 손실 수준을 계산하기 위해 여러 기술적 분석 지표를 결합합니다.
전략 원칙
이 전략의 핵심은 다음과 같은 핵심 요소에 기반합니다.
- 유동성 영역 분석: 특정 주기 내의 최저점과 최고점을 계산하여 잠재적인 지원 및 저항 영역을 식별한다.
- ATR 변동율 필터링: 평균 실제 변동 범위 ((ATR) 를 입수 및 위험 관리의 동적 값으로 사용한다.
- 트렌드 필터: 50주기 지수 이동 평균 ((EMA) 과 상대적으로 강한 지수 ((RSI) 를 결합하여 시장의 추세와 동력을 확인한다.
- 다이내믹 리스크 관리: ATR에 따라 자동으로 중지 및 중지 손실 수준을 계산하고 리스크 / 수익 비율을 유연하게 조정할 수 있습니다.
전략적 이점
- 다차원 신호 생성: 유동성, 변동률 및 경향 필터를 결합하여 신호 품질을 향상시킨다.
- 적응형 위험 관리: 동적으로 정지 손실을 조정하고 거래 위험을 효과적으로 제어합니다.
- 유연한 매개 변수 구성: ATR 길이, 유동성 주기 및 거래 시기를 사용자 정의 할 수 있습니다.
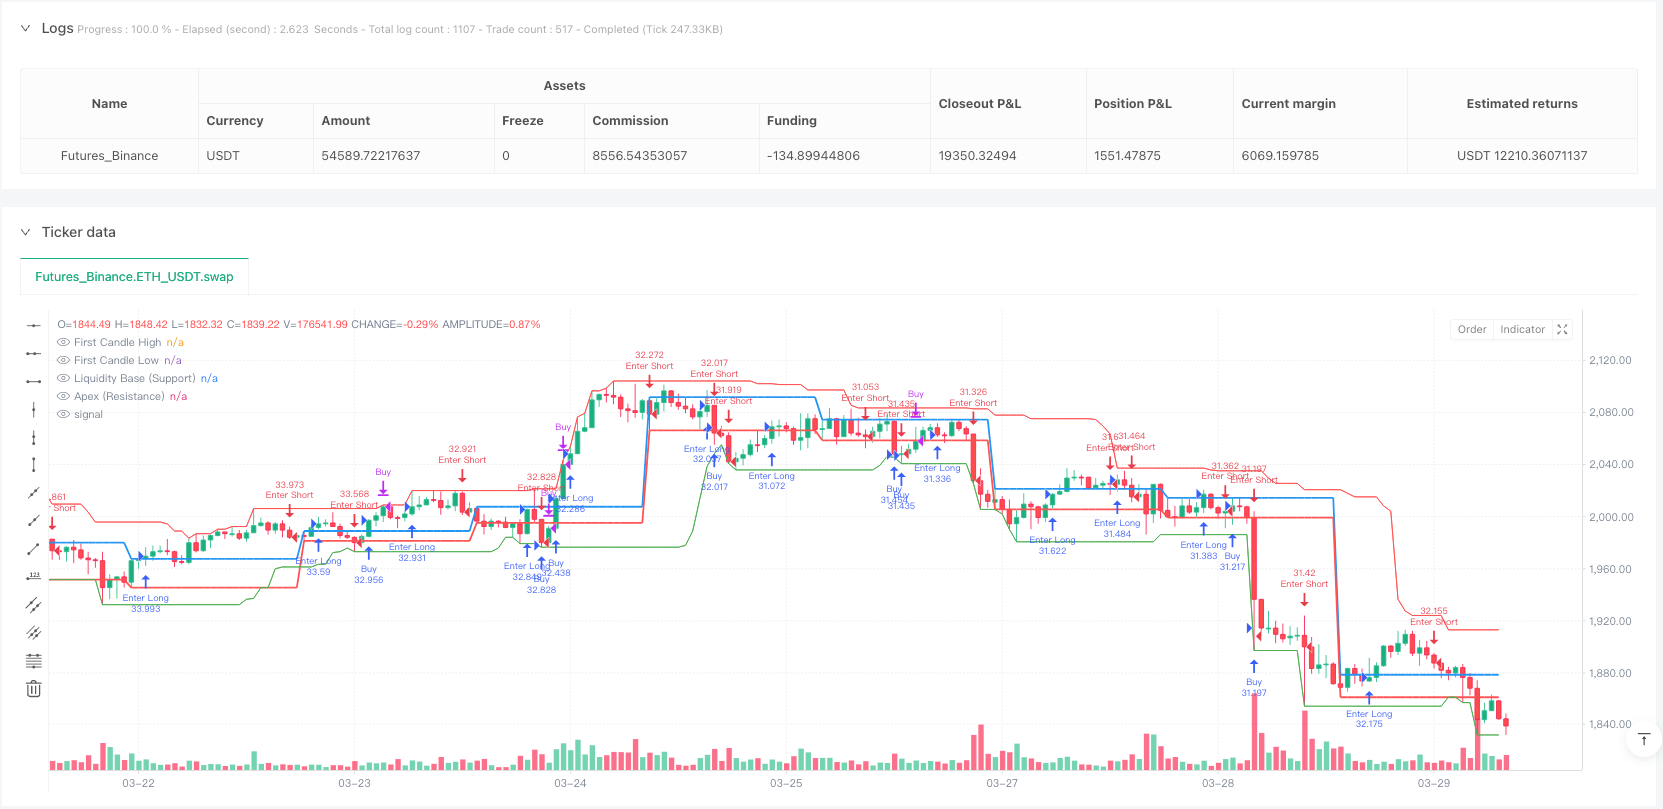
- 시각화 지원: 유동선과 첫 번째 K선 레벨의 시각화 표시를 제공합니다.
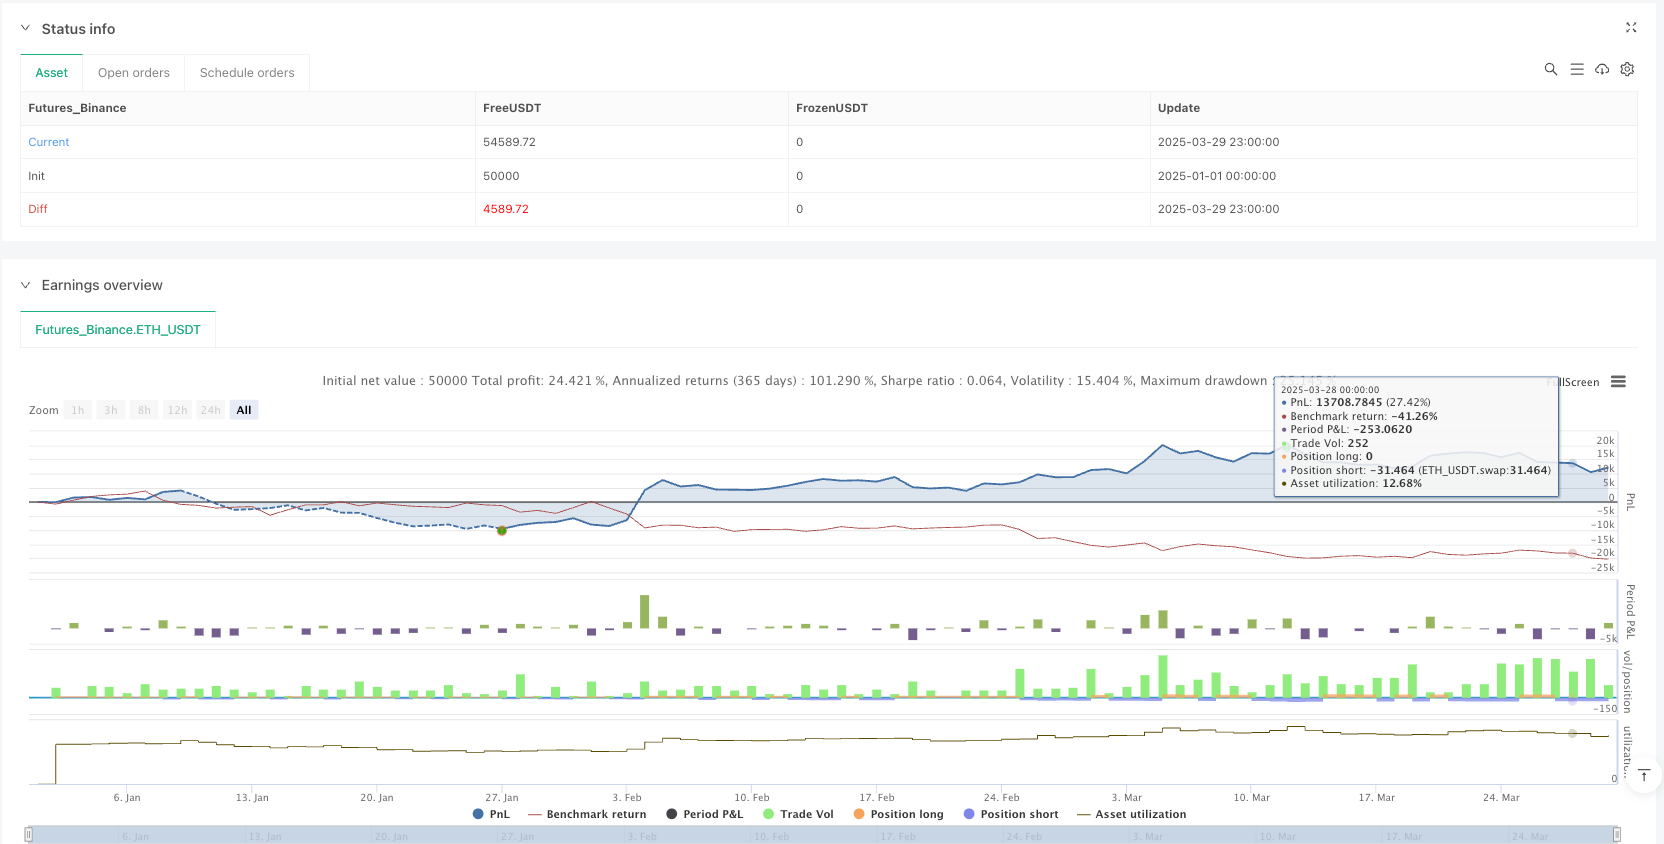
- 성능 추적: 내장 거래 통계는 차트에서 직접 우승률과 패배를 보여줍니다.
전략적 위험
- 매개 변수 민감성: 전략 성능은 매개 변수 선택에 크게 의존하며, 지속적인 재검토와 최적화가 필요합니다.
- 시장 적응성: 추세가 명확하지 않거나 높은 변동성이있는 시장에서 불안정 할 수 있습니다.
- 가짜 침입 위험: 유동성 영역 침입에 대해 잘못된 보고가 있을 수 있다.
- 거래 빈도: 세션 필터링과 복합 조건으로 인해 거래 기회가 줄어들 수 있습니다.
- 재검토 편향: 64%의 역사적인 승률은 미래의 성과를 완전히 나타내지 않을 수 있습니다.
전략 최적화 방향
- 기계 학습 통합: 기계 학습 알고리즘을 도입하여 동적으로 매개 변수 및 신호 생성을 조정한다.
- 다 시장 적응성: 다른 시장과 품종에 적용할 수 있는 더 일반적인 파라미터 설정을 개발한다.
- 깊이 있는 위험 관리: 더 복잡한 포지션 규모와 위험 분배 알고리즘을 도입한다.
- 신호 확인 메커니즘: 거래량이나 다른 기술 지표와 같은 추가 확인 지표를 추가하십시오.
- 실시간 성능 모니터링: 실시간 성능 평가 및 적응 조정 모듈 개발.
요약하다
ThinkTech AI 거래 전략은 혁신적인 다중 요소 방법을 통해 거래자에게 강력한 양적 거래 도구를 제공합니다. 유동성 분석, 변동성 필터링 및 동적 위험 관리로 인해 고품질의 거래 기회를 식별하기위한 전략입니다. 그러나 거래자는 전략의 잠재력을 최대한 발휘하기 위해 지속적인 재검토, 최적화 및 신중한 적용을해야합니다.
전략 소스 코드
/*backtest
start: 2025-01-01 00:00:00
end: 2025-03-30 00:00:00
period: 1h
basePeriod: 1h
exchanges: [{"eid":"Futures_Binance","currency":"ETH_USDT"}]
*/

if high > ta.highest(high[1], 5)
    strategy.entry("Enter Long", strategy.long)
else if low < ta.lowest(low[1], 5)
    strategy.entry("Enter Short", strategy.short)//@version=6
strategy("ThinkTech AI Signals", overlay=true, initial_capital=100000, default_qty_type=strategy.percent_of_equity, default_qty_value=100)

//──────────────────────────────
// Input Settings
//──────────────────────────────
riskRewardRatio    = input.float(title="Risk/Reward Ratio", defval=2.0, minval=1.0, step=0.1)

// Inputs from second script
liquidity_period   = input.int(20, title="Liquidity Base Period")
atr_length         = input.int(14, title="ATR Length")
atr_threshold      = input.float(0.3, title="ATR Breakout Threshold")
take_profit_mult   = input.float(0.25, title="Take-Profit Multiplier")
stop_loss_mult     = input.float(0.75, title="Stop-Loss Multiplier")
vol_filter         = input.bool(true, title="Enable Volume Filter")
session_filter     = input.bool(true, title="Limit to Trading Session")

// Additional inputs for further filtering and settings
atrMultiplier      = input.float(title="ATR Multiplier for Stop Loss", defval=1.5, minval=0.1, step=0.1)
retestCushionLong  = input.float(title="Retest Cushion Factor for BUY", defval=1.0, minval=1.0, step=0.001)
retestCushionShort = input.float(title="Retest Cushion Factor for SELL", defval=1.0, minval=0.0, maxval=1.0, step=0.001)
useTrendFilter     = input.bool(title="Use 50 EMA Trend Filter", defval=true)
useRSIFilter       = input.bool(title="Use RSI Filter", defval=false)
rsiPeriod          = input.int(title="RSI Period", defval=14, minval=1)
rsiOversold        = input.float(title="RSI Oversold Level", defval=30.0, minval=1, maxval=50)
rsiOverbought      = input.float(title="RSI Overbought Level", defval=70.0, minval=50, maxval=100)

// Option to remove plotted lines
showLiquidityLines   = input.bool(true, title="Show Liquidity Lines")
showFirstCandleLines = input.bool(true, title="Show First Candle Level Lines")

//──────────────────────────────
// Calculations & Variables (Liquidity & ATR Based)
//──────────────────────────────
price        = close
atr          = ta.atr(atr_length)
vol_condition = volume > ta.sma(volume, 20)

// Define Liquidity Base and Apex for support/resistance
liquidity_base = ta.lowest(low, liquidity_period)
apex           = ta.highest(high, liquidity_period)
// Track recent highs and lows for filtering
hh = ta.highest(high, 30)
ll = ta.lowest(low, 30)

//──────────────────────────────
// Trade Stats Variables
//──────────────────────────────
var float take_profit = na
var float stop_loss   = na
var bool  in_trade    = false
var int   win_count   = 0
var int   loss_count  = 0

//──────────────────────────────
// ENTRY LOGIC (BUY) Based on Liquidity & ATR
//──────────────────────────────
breakout_up      = price > liquidity_base + (atr * atr_threshold)
point_of_release = ta.crossover(price, liquidity_base) and breakout_up
retest_buy       = price > liquidity_base and price < hh and not in_trade

// Session condition (e.g. trading between 9AM–12PM)
session_condition = (hour >= 9 and hour <= 12) or not session_filter

if (point_of_release or retest_buy) and (vol_condition or not vol_filter) and session_condition
    strategy.entry("Buy", strategy.long)
    take_profit := price + (atr * take_profit_mult)
    stop_loss   := liquidity_base - (atr * stop_loss_mult)
    in_trade    := true
    alert("Buy Signal - Price: " + str.tostring(price), alert.freq_once_per_bar)

//──────────────────────────────
// ENTRY LOGIC (SELL) Based on Liquidity & ATR
//──────────────────────────────
breakout_down = price < apex - (atr * atr_threshold)
clean_break   = ta.crossunder(price, apex) and breakout_down
retest_sell   = price < apex and price > ll and not in_trade

if (clean_break or retest_sell) and (vol_condition or not vol_filter) and session_condition
    strategy.entry("Sell", strategy.short)
    take_profit := price - (atr * take_profit_mult)
    stop_loss   := apex + (atr * stop_loss_mult)
    in_trade    := true
    alert("Sell Signal - Price: " + str.tostring(price), alert.freq_once_per_bar)

//──────────────────────────────
// EXIT LOGIC (For BUY & SELL)
//──────────────────────────────
if strategy.position_size > 0
    if price >= take_profit
        strategy.close("Buy", comment="Take Profit")
        win_count += 1
        in_trade := false
    if price <= stop_loss
        strategy.close("Buy", comment="Stop Loss")
        loss_count += 1
        in_trade := false

if strategy.position_size < 0
    if price <= take_profit
        strategy.close("Sell", comment="Take Profit")
        win_count += 1
        in_trade := false
    if price >= stop_loss
        strategy.close("Sell", comment="Stop Loss")
        loss_count += 1
        in_trade := false

//──────────────────────────────
// Plot Liquidity Lines (Support/Resistance)
//──────────────────────────────
plot(showLiquidityLines ? liquidity_base : na, color=color.green, title="Liquidity Base (Support)")
plot(showLiquidityLines ? apex : na, color=color.red, title="Apex (Resistance)")

//──────────────────────────────
// Debugging Signal Shapes
//──────────────────────────────
plotshape(series=point_of_release, location=location.belowbar, color=color.green, style=shape.triangleup, title="Buy Signal")
plotshape(series=clean_break, location=location.abovebar, color=color.red, style=shape.triangledown, title="Sell Signal")

//──────────────────────────────
// Win/Loss Table Display
//──────────────────────────────
var table t = table.new(position.top_right, 1, 2)
if bar_index == last_bar_index
    table.cell(t, 0, 0, "Wins: " + str.tostring(win_count), bgcolor=color.new(color.green, 80))
    table.cell(t, 0, 1, "Losses: " + str.tostring(loss_count), bgcolor=color.new(color.red, 80))

//──────────────────────────────
// Alert Conditions for Entries and Exits
//──────────────────────────────
alertcondition(point_of_release, title="Buy Alert", message="Buy Signal Triggered")
alertcondition(clean_break, title="Sell Alert", message="Sell Signal Triggered")
var int lastClosedTrades = 0
var bool exitSignal = false
if strategy.closedtrades > lastClosedTrades
    exitSignal := true
    lastClosedTrades := strategy.closedtrades
alertcondition(exitSignal, title="EXIT Signal", message="EXIT signal triggered: Trade has closed (TP or SL reached).")

//──────────────────────────────
// FIRST 15-MINUTE CANDLE CAPTURE (9:30–9:45 AM EST)
//──────────────────────────────
newDay = dayofmonth != dayofmonth[1]
var float fHigh = na
var float fLow  = na
var bool  firstCandleCaptured = false
if newDay
    fHigh := high
    fLow  := low
    firstCandleCaptured := true

//──────────────────────────────
// Additional Filters & Calculations
//──────────────────────────────
// Trend Filter: 50 EMA
ema50       = ta.ema(close, 50)
longFilter  = not useTrendFilter or (close > ema50)
shortFilter = not useTrendFilter or (close < ema50)

// ATR-Based Stop Loss Buffer
atrValue       = ta.atr(14)
stopLossBuffer = atrValue * atrMultiplier

// RSI Calculation (if enabled)
rsiValue = ta.rsi(close, rsiPeriod)

//──────────────────────────────
// ENTRY CONDITIONS (15-Minute Candle Retest)
//──────────────────────────────
// Breakout/Breakdown based on the first candle levels
buyBreakout   = firstCandleCaptured and ta.crossover(close, fHigh)
sellBreakdown = firstCandleCaptured and ta.crossunder(close, fLow)
// Retest conditions: price must retest the level after the breakout/breakdown
buyRetest  = firstCandleCaptured and (low <= fHigh) and (close > fHigh)
sellRetest = firstCandleCaptured and (high >= fLow) and (close < fLow)
// Final entry signals (with optional RSI filter)
buySignal  = buyBreakout and buyRetest and longFilter and (strategy.position_size == 0) and (not useRSIFilter or (rsiValue < rsiOversold))
sellSignal = sellBreakdown and sellRetest and shortFilter and (strategy.position_size == 0) and (not useRSIFilter or (rsiValue > rsiOverbought))

//──────────────────────────────
// Trade Parameters for 15-Minute Candle Retest
//──────────────────────────────
candleRange    = fHigh - fLow
stopLossBuy    = fLow - stopLossBuffer
takeProfitBuy  = fHigh + (candleRange * riskRewardRatio)
stopLossSell   = fHigh + stopLossBuffer
takeProfitSell = fLow - (candleRange * riskRewardRatio)

//──────────────────────────────
// Execute Trades for 15-Minute Candle Retest
//──────────────────────────────
if buySignal
    strategy.entry("BUY", strategy.long)
    strategy.exit("TP/SL BUY", "BUY", stop=stopLossBuy, limit=takeProfitBuy)

if sellSignal
    strategy.entry("SELL", strategy.short)
    strategy.exit("TP/SL SELL", "SELL", stop=stopLossSell, limit=takeProfitSell)

//──────────────────────────────
// Plot First Candle Level Lines (Optional)
//──────────────────────────────
plot(showFirstCandleLines and firstCandleCaptured ? fHigh : na, title="First Candle High", color=color.blue, linewidth=2)
plot(showFirstCandleLines and firstCandleCaptured ? fLow : na, title="First Candle Low", color=color.red, linewidth=2)