동적 RSI 저점고점 다이버전스 트렌드 전략

2
Follow
502
Followers
개요
본 문서는 상대강도지수(RSI)의 저점·고점 다이버전스를 활용한 트렌드 추세 전략에 대해 상세히 설명합니다. 이 전략은 가격과 RSI 지표 간의 다이버전스를 식별하여 잠재적인 추세 반전 기회를 포착함으로써 트레이더에게 정확한 진입 및 청산 신호를 제공합니다. 시각적 신호와 기술적 지표 분석을 독창적으로 결합하여 트레이딩 의사 결정의 정확성과 적시성을 향상시키는 데 목적이 있습니다.
전략 원리
전략의 핵심 원리는 RSI의 저점·고점 다이버전스 이론에 기반합니다. 구체적인 구현은 다음과 같은 주요 단계를 포함합니다.
- RSI 지표 계산: 14주기 RSI 길이를 사용하여 시장의 현재 과매수·과매도 상태를 평가합니다.
- 가격 극점 식별: 록백(lookback) 기간을 통해 저점과 고점을 결정합니다.
- 다이버전스 판단 메커니즘:
- 강세 다이버전스: 가격이 신저점을 기록했으나 RSI는 동반 하락하지 않음
- 약세 다이버전스: 가격이 신고점을 기록했으나 RSI는 동반 상승하지 않음
- 신호 생성:
- 과매도 영역(30 미만)에서의 강세 다이버전스
- 과매수 영역(70 초과)에서의 약세 다이버전스
전략 장점
- 높은 정확도의 신호 식별: 엄격한 다이버전스 조건을 통해 가짜 신호를 줄입니다.
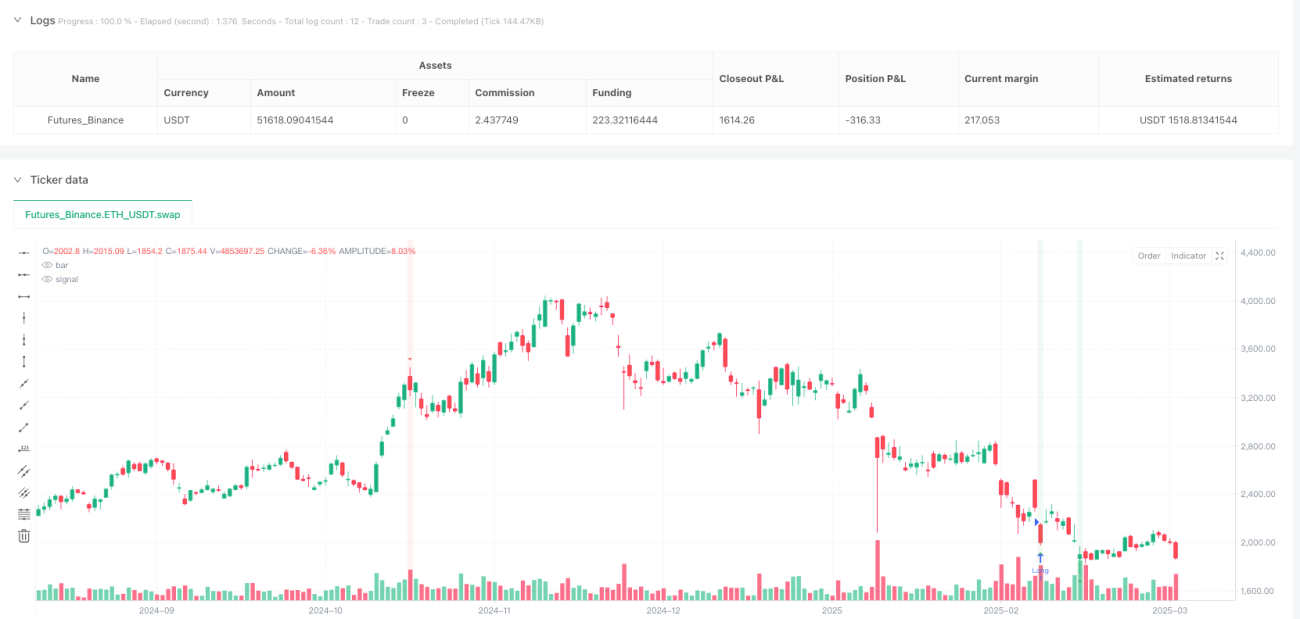
- 시각적 신호 표시: 큰 삼각형 마커와 배경 강조를 사용하여 신호 가독성을 향상시킵니다.
- 유연성: RSI 파라미터, 록백 기간 및 과매수·과매도 임계값을 조정할 수 있습니다.
- 다중 타임프레임 적응성: 1시간~4시간 주기에서 가장 우수한 성과를 보입니다.
- 디버깅 기능: 내장된 디버깅 테이블로 주요 지표 검증이 용이합니다.
전략 리스크
- 오판 리스크: 다이버전스 신호가 100% 정확하지 않으며, 일정 확률로 잘못된 신호가 발생할 수 있습니다.
- 시장 급변동: 강한 추세 시장에서는 다이버전스 전략의 성과가 저조할 수 있습니다.
- 파라미터 민감성: RSI 파라미터와 록백 기간의 부적절한 설정은 전략 효과를 떨어뜨릴 수 있습니다.
- 거래 비용: 잦은 거래로 인해 높은 수수료와 슬리피지 비용이 발생할 수 있습니다.
전략 최적화 방향
- 다중 지표 확인: 이동평균선, MACD 등의 지표를 결합하여 신호 정확도를 높입니다.
- 동적 파라미터 조정: 시장 변동성에 따라 RSI 파라미터를 지능적으로 조정합니다.
- 손절 메커니즘: ATR 기반의 동적 손절 전략을 도입합니다.
- 머신러닝 최적화: 머신러닝 알고리즘을 사용하여 진입 및 청산 지점을 동적으로 최적화합니다.
- 리스크 관리: 시장 변동성에 따라 포지션 규모를 조정합니다.
요약
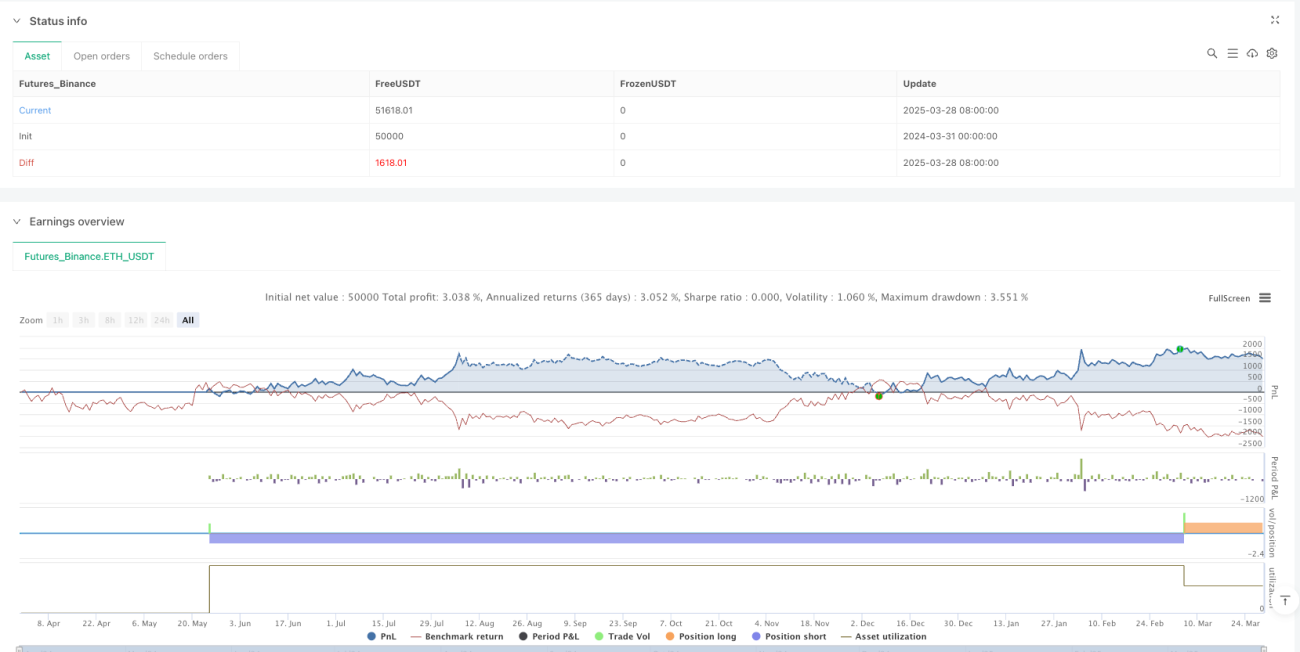
동적 RSI 저점·고점 다이버전스 트렌드 전략은 정밀한 기술적 지표 분석과 시각적 신호를 통해 트레이더에게 비교적 효율적인 추세 거래 방법을 제공합니다. 지속적인 최적화와 리스크 관리를 통해 이 전략은 다양한 시장 환경에서 안정적인 성과를 유지할 수 있을 것으로 기대됩니다.
Source
Pine
Strategy parameters
Related strategies
Comment
All comments (0)
No data
- 1