
[trans]
개요
다차원 피봇 포인트 거래 전략과 동적 피보나치 지표 시스템은 기술적 분석 기반의 거래 전략으로, 일중 피봇 포인트, 중심 구간(CPR), 피보나치 되돌림 수준, 거래량 가중 평균 가격(VWAP) 및 이동 평균선 등 여러 지표를 활용하여 잠재적인 매수 및 매도 기회를 식별합니다. 해당 전략은 일중 트레이더, 특히 3분 봉 차트를 사용하는 단기 트레이더에게 적합합니다. 전략의 핵심은 특정 조건의 캔들이 주요 지지 및 저항 수준에 접촉하는지 판단하여 거래 신호를 발생시키는 것입니다.
해당 전략은 일일 고가, 저가 및 종가를 사용하여 계산된 피봇 포인트 시스템을 활용하며, 거래량 가중 평균 가격(VWAP) 및 이동 VWAP(MVWAP)를 동적 지지 및 저항 기준으로 사용합니다. 동시에 상대 강도 지수(RSI), 단순 이동 평균(SMA) 및 지수 이동 평균(EMA) 등의 기술적 지표를 통해 포괄적인 거래 의사 결정 시스템을 구축합니다.
전략은 먼저 조건에 맞는 녹색(상승) 및 적색(하락) 캔들을 식별한 다음, 해당 캔들이 피봇 포인트, 지지선, 저항선 또는 VWAP 등 주요 가격 수준에 닿았는지 판단합니다. 적색 캔들이 주요 가격 수준에 닿으면 매수 신호(CE)가 발생하고, 녹색 캔들이 주요 가격 수준에 닿으면 매도 신호(PE)가 발생합니다. 이러한 반전 사고는 주요 가격 수준에서 잠재적인 반전 지점을 찾는 핵심 개념을 반영합니다.
전략 원리
해당 전략의 원리는 가격이 주요 지지 및 저항선 주변에서 변동하는 시장 행동에 기반하며, 캔들 패턴, 거래량 및 모멘텀 지표를 결합하여 거래 결정을 내립니다. 구체적인 원리 분석은 다음과 같습니다.
-
캔들 식별 메커니즘:
- 녹색 캔들(상승): 종가가 시가보다 높고, 캔들 몸통 높이가 최소 17포인트이며, 시가가 저가에 0.382배의 캔들 범위를 더한 값보다 낮고, 종가가 저가에 0.682배의 캔들 범위를 더한 값보다 높습니다.
- 적색 캔들(하락): 종가가 시가보다 낮고, 캔들 몸통 높이가 최소 17포인트입니다.
-
피봇 포인트 계산 체계:
- 일일 피봇 포인트(PP): (일일 고가 + 일일 저가 + 일일 종가) / 3
- 저항선: R1, R2, R3, R4
- 지지선: S1, S2, S3, S4
- 중심 구간(CPR): 하단 CPR과 상단 CPR로 구성되며, 시장이 횡보할 수 있는 가격 영역을 제공합니다.
-
가격 동적 참조:
- VWAP(거래량 가중 평균 가격): 거래량 요소를 고려한 평균 가격 수준을 반영합니다.
- MVWAP(이동 거래량 가중 평균 가격): VWAP의 이동 평균으로, 더 부드러운 가격 참조를 제공합니다.
-
보조 지표 시스템:
- RSI: 시장의 과매수/과매도 상태를 측정합니다.
- SMA(50주기) 및 EMA(20주기): 가격 추세 방향 참조를 제공합니다.
- 거래량 분석: 20주기 거래량 평균선을 통해 거래량 추세를 평가합니다.
-
거래 신호 생성:
- 조건에 맞는 적색 캔들이 피봇 포인트, 지지선, 저항선 또는 VWAP/MVWAP에 닿으면 매수 신호(CE)가 생성됩니다.
- 조건에 맞는 녹색 캔들이 피봇 포인트, 지지선, 저항선 또는 VWAP/MVWAP에 닿으면 매도 신호(PE)가 생성됩니다.
전략의 핵심 사고는 주요 지지 및 저항선 근처에서 가격의 잠재적 반전을 포착하는 것이며, 특정 캔들 패턴과 여러 기술적 지표를 필터링하여 신호 유효성을 높입니다. 피봇 포인트에 닿는 캔들은 종종 시장이 이러한 주요 가격 수준에서 주저하거나 반전할 가능성이 증가했음을 나타냅니다.
전략 장점
해당 전략 코드를 심층 분석하면 다음과 같은 현저한 장점을 요약할 수 있습니다.
-
다차원 검증 메커니즘: 여러 기술적 지표(피봇 포인트, VWAP, 이동 평균선, RSI)를 결합하여 거래 신호를 검증함으로써 가짜 신호 위험을 낮춥니다.
-
시장에 대한 동적 적응: 일중 피봇 포인트 시스템이 매일 업데이트되어 전략이 다양한 시장 환경과 변동성에 적응할 수 있습니다.
-
정확한 캔들 식별: 엄격한 캔들 패턴 조건과 피보나치 수준을 통해 유망한 거래 기회를 선별하여 신호 품질을 높입니다.
-
유연한 표시 설정: 전략은 뷰 적응 기능을 가지고 있어 적절한 시간 프레임(15분 미만의 일중 차트)에서만 피봇 포인트를 표시하여 차트 복잡성을 줄입니다.
-
역방향 사고의 장점: 전략은 적색 캔들이 중요 위치에 닿을 때 매수 기회를 찾고, 녹색 캔들이 중요 위치에 닿을 때 매도 기회를 찾아 시장의 잠재적인 단기 과매수/과매도 상태를 활용합니다.
-
완전한 가격 계층 체계: 다중 지지선(S1-S4) 및 저항선(R1-R4)을 포함하여 다양한 변동폭의 시장 환경에 적합한 풍부한 참조 가격을 제공합니다.
-
중심 구간(CPR) 통합: CPR은 당일 잠재적인 횡보 영역 식별을 제공하며, 이는 일중 거래에서 중요한 참조 가치를 갖습니다.
-
시각적 지원: 풍부한 마커와 도형 표시를 통해 차트에서 조건에 맞는 캔들과 주요 가격 접촉 상황을 직관적으로 식별하여 트레이더가 빠르게 파악할 수 있도록 합니다.
-
거래량 확인: 거래량 분석을 결합하여 거래량 평균선을 통해 시장 참여도를 평가하고 신호 신뢰성을 강화합니다.
-
일중 거래에 적합: 전략은 짧은 시간 프레임(특히 3분 차트)에 최적화되어 있어, 일중 트레이더가 시장 변동성을 활용하여 빈번한 거래를 할 수 있도록 합니다.
이러한 장점들은 해당 전략을 종합적이고 적응성이 뛰어난 일중 거래 시스템으로 만들어 주며, 특히 기술적 분석에 대한 기본 지식을 갖추고 가격 행동과 주요 가격 수준에 기반하여 거래하고자 하는 투자자에게 적합합니다.
전략 리스크
해당 전략은 여러 장점을 가지고 있지만, 동시에 트레이더가 신중하게 대응해야 할 몇 가지 잠재적 리스크도 존재합니다.
-
과도한 신호 리스크: 전략이 여러 피봇 포인트(PP, R1-R4, S1-S4) 및 기타 지표를 포함하므로 변동성이 큰 시장에서 너무 많은 신호를 생성하여 거래 빈도와 수수료 증가를 초래할 수 있습니다.
- 해결 방법: 거래 시간 제한이나 추세 확인 조건과 같은 추가 필터 조건을 고려할 수 있습니다.
-
역방향 거래 함정: 전략이 역방향 논리(적색 캔들이 중요 위치에 닿으면 매수, 녹색 캔들이 중요 위치에 닿으면 매도)를 기반으로 하므로 강한 추세 시장에서 연속적인 손실을 초래할 수 있습니다.
- 해결 방법: 전략 사용 전에 전체 시장 추세를 평가하고, 강한 추세에서 역방향 거래를 피하기 위해 추세 필터를 추가할 수 있습니다.
-
매개변수 민감성: 전략의 효과는 캔들 식별 매개변수(예: 캔들 높이가 17포인트 이상) 및 이동 평균선 주기 설정에 크게 의존하며, 시장 환경에 따라 다른 매개변수가 필요할 수 있습니다.
- 해결 방법: 다양한 종목과 시장 조건에 대해 백테스트를 수행하여 매개변수 설정을 최적화합니다.
-
손절 메커니즘 부재: 코드에 손절 전략이 명확히 설정되어 있지 않아 개별 손실이 과도해질 수 있습니다.
- 해결 방법: ATR 기반 동적 손절 또는 고정 포인트 손절과 같은 명확한 손절 전략을 구현합니다.
-
일중 전략의 한계: 3분 차트에 집중하는 일중 전략으로서 중장기 보유에 적합하지 않으며, 잠재적인 장기 추세 기회를 놓칠 수 있습니다.
- 해결 방법: 이 전략을 거래 시스템의 일부로 간주하고 중장기 전략과 함께 사용합니다.
-
피봇 포인트의 한계: 횡보 시장에서 가격이 여러 피봇 포인트를 빈번하게 터치하여 혼란스러운 신호를 생성할 수 있습니다.
- 해결 방법: 횡보 시장에서는 일시적으로 전략을 중단하거나 신호 확인 조건을 추가할 수 있습니다.
-
거래량 가중치 조정 부재: VWAP을 사용하지만, 전략은 거래량 크기에 따라 신호 가중치를 동적으로 조정하지 않습니다.
- 해결 방법: 충분한 시장 참여도가 있을 때만 거래하도록 거래량 임계값 조건을 추가할 수 있습니다.
-
시간 의존성: 일일 피봇 포인트는 전날 데이터를 기반으로 하므로, 거래일 시작 시 당일 데이터가 충분하지 않아 불안정하게 작동할 수 있습니다.
- 해결 방법: 거래일 시작 후 30~60분 후에 전략을 활성화하여 충분한 시장 정보를 확보하는 것을 고려합니다.
-
자동화 구현 과제: 전략이 여러 조건 판단을 포함하므로, 실제 자동 실행 시 지연 또는 실행 지연 문제가 발생할 수 있습니다.
- 해결 방법: 실행 시스템을 최적화하여 지연 시간을 최소화하거나, 반자동 방식과 수동 확인을 결합하는 것을 고려합니다.
-
백테스트 편향 리스크: 코드의 녹색/적색 캔들 식별 논리가 백테스트와 실시간 환경에서 일관되게 작동하지 않을 수 있습니다.
- 해결 방법: 엄격한 실시간 모의 테스트를 수행하여 전략이 실제 거래 환경에서도 유효한지 확인합니다.
이러한 리스크를 인식하고 관리하는 것은 전략의 성공적인 적용에 매우 중요하며, 트레이더는 자신의 리스크 허용 범위와 거래 습관에 따라 적절히 조정해야 합니다.
전략 최적화 방향
코드의 심층 분석을 바탕으로 다음과 같은 주요 최적화 방향을 제시합니다.
-
동적 캔들 식별 매개변수:
- 현재 전략은 유효 캔들을 식별하기 위해 고정 값(예: 캔들 높이가 최소 17포인트)을 사용하지만, 이를 ATR(평균 실제 변동 범위) 기반의 동적 매개변수로 변경하여 다양한 변동성 환경에 더 잘 적응할 수 있습니다.
- 최적화 이유: 고정 매개변수는 변동성 환경에 따라 효과 차이가 크며, 동적 매개변수는 전략의 적응성을 높입니다.
-
추세 필터 시스템:
- 더 높은 시간 프레임(예: 15분 또는 30분)의 추세 판단을 추가하여 주 추세 방향으로만 거래를 실행하거나 신호 가중치를 조정합니다.
- 최적화 이유: 강한 추세에서 빈번한 역방향 거래를 피하여 승률과 손익비를 높입니다.
-
신호 품질 평가 메커니즘:
- 각 거래 신호에 대해 캔들 강도, 접촉한 피봇 포인트 중요도, RSI 값, 거래량 이상 징후 등 여러 요소를 고려한 종합 평가 시스템을 구축합니다.
- 최적화 이유: 모든 신호의 품질이 동일하지 않으므로, 평가 시스템을 통해 저품질 신호를 걸러내 거래 효율성을 높일 수 있습니다.
-
자금 관리 통합:
- 신호 강도와 시장 조건에 따라 포지션 크기를 동적으로 조정하여 고확률 기회에는 포지션을 늘리고, 저확률 상황에서는 리스크 노출을 줄입니다.
- 최적화 이유: 효과적인 자금 관리는 장기 수익성에 매우 중요하며, 전략 성과를 크게 개선할 수 있습니다.
-
다중 시간 프레임 확인:
- 신호 생성 전에 여러 시간 프레임의 조건 일관성을 확인합니다. 예를 들어, 3분 차트와 15분 차트의 신호가 일치할 때 거래합니다.
- 최적화 이유: 다중 시간 프레임 확인은 오류 신호 확률을 낮추고 거래 정확도를 높입니다.
-
손절 및 이익 실현 메커니즘:
- 변동성 기반 동적 손절이나 주요 구조적 위치 손절과 같은 지능형 손절 시스템을 구현하고, 동시에 자동 이익 실현 목표를 설정합니다.
- 최적화 이유: 완전한 리스크 관리는 큰 폭의 하락을 방지하고 이익을 보호하는 데 중요합니다.
-
거래 시간 필터:
- 효율적 및 비효율적 거래 시간대를 식별하고, 시장 변동성이 낮거나 혼란스러운 시간대(예: 점심 시간 또는 시장 개장 및 마감 전후)를 피합니다.
- 최적화 이유: 시간대별 시장 행동 특성이 다르므로 선택적 거래는 전체 효율성을 높일 수 있습니다.
-
적응형 지표 매개변수:
- 고정된 기술적 지표 매개변수(예: RSI 14주기, EMA 20주기)를 시장 상태에 따라 자동으로 조정되는 매개변수로 변경합니다.
- 최적화 이유: 시장 조건이 변하면 최적 지표 매개변수도 조정되어야 하며, 지표 민감도를 높일 수 있습니다.
-
시장 환경 분류:
- 현재 시장 환경(추세, 횡보, 고변동성 등)을 자동으로 식별하는 알고리즘을 추가하고, 각 환경에 맞게 다른 매개변수 설정을 적용합니다.
- 최적화 이유: 단일 매개변수 설정으로 모든 시장 환경에서 최상의 성과를 내기 어렵습니다. 환경 적응형 조정은 전략 안정성을 크게 향상시킬 수 있습니다.
-
머신러닝 강화:
- 신호 성공 확률 예측을 위한 머신러닝 모델 통합 고려. 과거 패턴 인식을 기반으로 거래 신호를 필터링하고 우선순위를 지정합니다.
- 최적화 이유: 머신러닝은 사람이 식별하기 어려운 복잡한 패턴을 발견하여 전략의 지능 수준을 높일 수 있습니다.
위의 최적화 방향을 구현함으로써, 해당 전략은 기존 강점을 유지하면서 적응성, 정확성 및 장기 수익성을 크게 향상시켜 다양한 시장 조건의 도전에 더 잘 대응할 수 있습니다.
요약
다차원 피벗 포인트 거래 전략과 동적 피보나치 지표 시스템은 종합적이고 구조가 잘 갖춰진 데이 트레이딩 전략 시스템입니다. 전통적인 기술적 분석 도구(피벗 포인트, 피보나치 되돌림, 이동평균선)와 현대적인 동적 지표(VWAP, CPR)를 교묘하게 결합하고, 엄격한 캔들 조건 필터링과 다중 지표 확인을 통해 트레이더에게 잠재력 있는 데이 트레이딩 프레임워크를 제공합니다.
이 전략의 핵심 강점은 주요 가격 레벨에 대한 포괄적인 커버리지와 잠재적 반전 지점에 대한 민감한 포착에 있습니다. 엄격한 캔들 식별 조건을 설정함으로써 전략은 무의미한 시장 노이즈를 대량으로 걸러내고 높은 확률의 거래 기회에 집중할 수 있습니다. 동시에 거래량 및 모멘텀 지표의 사용을 통해 신호의 신뢰성을 더욱 강화합니다.
그러나 전략에는 신호 과다, 반대 거래 위험, 매개변수 최적화 문제 등 몇 가지 한계도 존재합니다. 이러한 문제에 대응하여 동적 매개변수 조정, 다중 시간 프레임 확인, 스마트 자금 관리, 시장 환경 적응 등 여러 최적화 방향을 제안했습니다. 이러한 최적화는 트레이더가 자신의 필요와 시장 특성에 맞춰 전략을 조정하고 전반적인 거래 성과를 향상시키는 데 도움이 될 수 있습니다.
주목할 점은 어떤 거래 전략도 "만능 도구"가 아니라는 것입니다. 성공적인 거래는 전략 자체 외에도 트레이더의 인내심, 규율 및 지속적인 학습이 필요합니다. 이 전략에 대해 트레이더는 먼저 시뮬레이션 환경에서 충분히 테스트하고 다양한 시장 조건에서의 성과 특성을 숙지한 후, 점진적으로 매개변수를 조정하여 특정 거래 종목과 개인 스타일에 적응시키고, 궁극적으로 개인화된 지속 가능한 수익 창출 거래 시스템을 구축할 것을 권장합니다.
지속적인 실천, 피드백 및 최적화를 통해 다차원 피벗 포인트 거래 전략과 동적 피보나치 지표 시스템은 데이 트레이더의 도구 상자에서 강력한 무기가 되어, 일중 시장 변동을 포착하는 신뢰할 수 있는 기술적 분석 프레임워크를 제공할 수 있습니다.
개요
다차원 피벗 포인트 거래 시스템과 동적 피보나치 지표는 기술적 분석 기반의 거래 전략으로, 일일 피벗 포인트, 중앙 피벗 범위(CPR), 피보나치 되돌림 수준, 거래량 가중 평균 가격(VWAP) 및 이동평균선을 활용하여 잠재적인 매수 및 매도 기회를 식별합니다. 이 전략은 특히 데이 트레이더, 특히 3분 차트 시간 프레임에 집중하는 트레이더에게 적합합니다. 전략의 핵심은 특정 조건을 충족하는 캔들이 주요 지지 및 저항 수준에 닿는지 확인하여 거래 신호를 발생시키는 것입니다.
이 전략은 일일 고가, 저가, 종가를 기준으로 계산된 피벗 포인트 시스템을 사용하며, 거래량 가중 평균 가격(VWAP) 및 이동 VWAP(MVWAP)를 동적 지지 및 저항 참조로 결합합니다. 또한 상대 강도 지수(RSI), 단순 이동평균(SMA), 지수 이동평균(EMA) 같은 기술적 지표를 포함하여 포괄적인 거래 결정 시스템을 만듭니다.
전략은 먼저 자격을 갖춘 녹색(강세) 및 빨간색(약세) 캔들을 식별한 다음, 이러한 캔들이 피벗 포인트, 지지 수준, 저항 수준 또는 VWAP와 같은 주요 가격 수준에 닿는지 확인합니다. 빨간색 캔들이 주요 가격 수준에 닿으면 매수 신호(CE)가 발생하고, 녹색 캔들이 주요 가격 수준에 닿으면 매도 신호(PE)가 발생합니다. 이러한 역추세 접근 방식은 주요 가격 수준에서 잠재적 반전 지점을 찾는 핵심 개념을 반영합니다.
전략 원리
이 전략의 원리는 가격이 주요 지지 및 저항 수준 주변에서 변동하는 시장 행동에 기반하며, 캔들 패턴, 거래량 및 모멘텀 지표를 결합하여 거래 결정을 내립니다. 구체적인 원리는 다음과 같이 분석됩니다.
-
캔들 식별 메커니즘:
- 녹색 캔들(강세): 종가가 시가보다 높고, 캔들 몸통 높이가 최소 17포인트이며, 시가가 저가 + 캔들 범위의 0.382배보다 낮고, 종가가 저가 + 캔들 범위의 0.682배보다 높습니다.
- 빨간색 캔들(약세): 종가가 시가보다 낮고, 캔들 몸통 높이가 최소 17포인트입니다.
-
피벗 포인트 계산 시스템:
- 일일 피벗 포인트(PP): (일일 고가 + 일일 저가 + 일일 종가) / 3
- 저항 수준: R1, R2, R3, R4
- 지지 수준: S1, S2, S3, S4
- 중앙 피벗 범위(CPR): 하단 CPR과 상단 CPR로 구성되며, 시장이 통합될 수 있는 가격 영역을 제공합니다.
-
동적 가격 참조:
- VWAP(거래량 가중 평균 가격): 거래량 요소를 고려한 평균 가격 수준을 반영합니다.
- MVWAP(이동 거래량 가중 평균 가격): VWAP의 이동평균으로, 더 부드러운 가격 참조를 제공합니다.
-
보조 지표 시스템:
- RSI: 시장의 과매수/과매도 상태를 측정하는 데 사용됩니다.
- SMA(50기간) 및 EMA(20기간): 가격 추세 방향 참조를 제공합니다.
- 거래량 분석: 20기간 거래량 이동평균을 통해 거래량 추세를 평가합니다.
-
트레이딩 신호 생성:
- 조건에 맞는 빨간 캔들이 피벗 포인트, 지지선, 저항선 또는 VWAP/MVWAP에 닿으면 매수 신호(CE)가 생성됩니다.
- 조건에 맞는 초록 캔들이 피벗 포인트, 지지선, 저항선 또는 VWAP/MVWAP에 닿으면 매도 신호(PE)가 생성됩니다.
이 전략의 핵심 아이디어는 주요 지지 및 저항 수준 근처에서 발생하는 잠재적 반전을 포착하고, 특정 캔들 패턴과 여러 기술적 지표를 통해 필터링하여 신호의 유효성을 높이는 것입니다. 피벗 포인트에 닿는 캔들은 종종 이러한 주요 가격 수준에서 시장의 망설임 또는 반전 가능성이 높아졌음을 나타냅니다.
전략의 장점
전략 코드를 심층 분석한 결과 다음과 같은 중요한 장점이 드러났습니다.
-
다차원 검증 메커니즘: 여러 기술적 지표(피벗 포인트, VWAP, 이동 평균, RSI)를 결합하여 거래 신호를 검증함으로써 허위 신호 위험을 줄입니다.
-
동적 시장 적응: 일일 피벗 포인트 시스템이 매일 업데이트되어 전략이 다양한 시장 환경과 변동성에 적응할 수 있게 합니다.
-
정확한 캔들 식별: 엄격한 캔들 패턴 조건과 피보나치 레벨을 통해 잠재적 거래 기회를 선별하여 신호 품질을 향상시킵니다.
-
유연한 표시 설정: 이 전략은 보기 적응 기능을 갖추고 있어 적절한 시간대(15분 미만의 일중 차트)에서만 피벗 포인트를 표시하여 차트의 혼잡을 줄입니다.
-
역발상 사고의 장점: 이 전략은 빨간 캔들이 주요 수준에 닿을 때 매수 기회를 찾고, 초록 캔들이 주요 수준에 닿을 때 매도 기회를 찾음으로써 잠재적인 단기 과매수/과매도 시장 상황을 활용합니다.
-
완벽한 가격 수준 계층 구조: 여러 단계의 지지 및 저항(S1-S4 및 R1-R4)을 포함하여 다양한 변동성 범위의 시장 환경에 적합한 풍부한 참조 가격을 제공합니다.
-
통합 중앙 피벗 범위(CPR): CPR은 당일 잠재적 통합 영역을 식별하는 기능을 제공하며, 이는 일중 거래에서 중요한 참조 가치를 가집니다.
-
시각적 지원: 풍부한 마커와 도형을 통해 조건에 맞는 캔들과 주요 가격 수준에 닿는 사례가 차트에 직관적으로 표시되어 트레이더가 신속하게 식별할 수 있습니다.
-
거래량 확인: 거래량 분석을 통합하여 거래량 이동 평균을 통해 시장 참여도를 평가함으로써 신호 신뢰성을 높입니다.
-
일중 거래에 적합: 이 전략은 단기 시간대(특히 3분 차트)에 특별히 설계되어 빈번한 거래를 통해 시장 변동을 활용하려는 일중 트레이더에게 적합합니다.
이러한 장점들은 이 전략을 강력하고 적응력 있는 일중 거래 시스템으로 만들며, 특히 기술적 분석에 대한 이해도가 높고 가격 움직임과 주요 가격 수준을 기반으로 거래하려는 투자자에게 적합합니다.
전략의 위험 요소
많은 장점에도 불구하고, 이 전략은 트레이더가 신중히 대처해야 할 몇 가지 잠재적 위험을 제시합니다.
-
과도한 신호 위험: 전략이 여러 피벗 포인트(PP, R1-R4, S1-S4) 및 기타 지표를 포함하기 때문에 변동성이 큰 시장에서 너무 많은 신호를 생성하여 빈번한 거래와 수수료 증가를 초래할 수 있습니다.
- 해결책: 거래 세션 제한이나 추세 확인 조건과 같은 추가 필터링 조건을 고려하십시오.
-
역추세 거래의 함정: 이 전략은 역추세 논리(빨간 캔들이 주요 수준에 닿을 때 매수, 초록 캔들이 닿을 때 매도)를 기반으로 하므로 강한 추세 시장에서 연속적인 손실로 이어질 수 있습니다.
- 해결책: 전략을 사용하기 전에 전체 시장 추세를 평가하고, 강한 추세에서 역추세 거래를 피하기 위해 추세 필터를 추가하십시오.
-
매개변수 민감도: 전략의 효과성은 캔들 식별 매개변수(예: 캔들 높이가 17포인트 이상)와 이동평균 기간 설정에 크게 의존하며, 시장 환경에 따라 다른 매개변수가 필요할 수 있습니다.
- 해결책: 다양한 종목과 시장 조건에서 백테스트를 수행하여 매개변수 설정을 최적화합니다.
-
손절 메커니즘 부재: 코드에 명시적인 손절 전략이 설정되어 있지 않아, 단일 거래에서 과도한 손실이 발생할 수 있습니다.
- 해결책: ATR 기반의 동적 손절 또는 고정 포인트 손절과 같은 명확한 손절 전략을 구현합니다.
-
데이트레이딩 전략의 한계: 3분봉에 초점을 맞춘 전략으로 중장기 보유에 적합하지 않으며, 장기 추세의 기회를 놓칠 수 있습니다.
- 해결책: 이 전략을 거래 시스템의 일부로 보고 중장기 전략과 함께 사용합니다.
-
피봇 포인트의 한계: 박스권 시장에서 가격이 여러 피봇 포인트를 자주 접촉하여 혼란스러운 신호를 생성할 수 있습니다.
- 해결책: 횡보 시장에서는 전략을 일시적으로 비활성화하거나 신호 확인 조건을 추가하는 것을 고려합니다.
-
거래량 가중치 조정 부족: VWAP를 사용하지만, 전략은 거래량 규모에 따라 신호 가중치를 동적으로 조정하지 않습니다.
- 해결책: 거래량 임계값 조건을 추가하여 충분한 시장 참여가 있을 때만 거래가 이루어지도록 합니다.
-
시간 의존성: 일일 피봇 포인트는 전일 데이터를 기반으로 하며, 새로운 거래일 시작 시 현재일 데이터가 부족하여 불안정하게 작동할 수 있습니다.
- 해결책: 거래일 시작 후 30~60분 후에 전략을 활성화하여 충분한 시장 정보를 수집합니다.
-
자동화 구현의 어려움: 전략은 여러 조건 판단을 포함하므로, 실제 자동 실행 시 지연이나 적시 실행 실패가 발생할 수 있습니다.
- 해결책: 실행 시스템을 최적화하여 지연 시간을 낮추거나, 수동 확인이 결합된 반자동 방식을 고려합니다.
-
백테스트 편향 위험: 코드의 양봉/음봉 식별 로직은 백테스트와 실거래 환경에서 일관성 없이 작동할 수 있습니다.
- 해결책: 엄격한 실시간 모의 테스트를 수행하여 전략이 실제 거래 환경에서도 효과적임을 확인합니다.
이러한 위험을 인식하고 관리하는 것은 이 전략을 성공적으로 적용하는 데 중요합니다. 트레이더는 자신의 위험 허용 범위와 거래 습관에 따라 적절히 조정해야 합니다.
전략 최적화 방향
코드에 대한 심층 분석을 바탕으로, 이 전략을 최적화하기 위한 주요 방향은 다음과 같습니다.
-
동적 캔들 식별 매개변수:
- 현재 전략은 유효 캔들을 식별하기 위해 고정값(예: 캔들 높이 최소 17포인트)을 사용합니다. 이를 ATR(평균 진폭 범위) 기반의 동적 매개변수로 변경하여 다양한 변동성 환경에 더 잘 적응할 수 있습니다.
- 최적화 근거: 고정 매개변수는 변동성 환경에 따라 성능이 달라지며, 동적 매개변수는 전략의 적응력을 향상시킵니다.
-
추세 필터링 시스템:
- 상위 시간 프레임(예: 15분 또는 30분)의 추세 판단을 추가하여 주 추세 방향으로만 거래를 실행하거나 신호 가중치를 조정합니다.
- 최적화 근거: 강한 추세에서 잦은 역추세 거래를 피하여 승률과 위험보상비율을 개선합니다.
-
신호 품질 점수 메커니즘:
- 각 거래 신호에 대해 종합 점수 시스템을 구축하여 캔들 강도, 접촉한 피봇 포인트의 중요성, RSI 값, 거래량 이상 징후 등 여러 요소를 고려합니다.
- 최적화 근거: 모든 신호의 품질이 동일하지 않으므로, 점수 시스템을 통해 낮은 품질의 신호를 걸러내고 거래 효율성을 높입니다.
-
자본 관리 통합:
- 신호 강도와 시장 상황에 따라 포지션 크기를 동적으로 조정하여, 높은 확률의 기회에는 포지션을 확대하고 낮은 확률의 상황에서는 리스크 노출을 줄입니다.
- 최적화 근거: 효과적인 자본 관리는 장기 수익성에至关重要하며, 전략 성과를 크게 개선할 수 있습니다.
-
다중 시간대 확인:
- 신호 생성 전에 여러 시간대에서 조건 일관성을 확인합니다. 예를 들어, 3분 차트와 15분 차트의 신호가 일치할 때만 거래합니다.
- 최적화 근거: 다중 시간대 확인은 잘못된 신호의 확률을 줄이고 거래 정밀도를 높일 수 있습니다.
-
손절 및 익절 메커니즘:
- 변동성 기반 동적 손절이나 주요 구조적 위치 손절과 같은 스마트 손절 시스템을 구현하고, 자동 익절 목표를 설정합니다.
- 최적화 근거: 건전한 리스크 관리는 큰 손실을 피하고 수익을 보호하는 데 중요합니다.
-
거래 시간 필터:
- 효율적인 거래 시간과 비효율적인 거래 시간을 식별하여, 낮은 변동성 구간이나 혼란스러운 시간(점심 시간, 장 개장 전후 등)을 피합니다.
- 최적화 근거: 각 세션별 시장 행동 특성이 다르므로, 선택적 거래가 전체 효율성을 높일 수 있습니다.
-
적응형 지표 파라미터:
- 고정된 기술적 지표 파라미터(예: 14기간 RSI, 20기간 EMA)를 시장 상태에 따라 자동 조정되는 파라미터로 변경합니다.
- 최적화 근거: 시장 조건이 변하면 최적 지표 파라미터도 함께 조정되어야 지표 민감도가 향상됩니다.
-
시장 환경 분류:
- 현재 시장 환경(추세, 횡보, 고변동성 등)을 자동 식별하는 알고리즘을 추가하고, 환경에 따라 다른 파라미터 설정을 적용합니다.
- 최적화 근거: 단일 파라미터 설정은 모든 시장 환경에서 최적으로 작동하기 어렵습니다. 환경 적응형 조정은 전략 안정성을 크게 향상시킬 수 있습니다.
-
머신러닝 강화:
- 머신러닝 모델을 통합하여 신호 성공 확률을 예측하고, 과거 패턴 인식을 기반으로 거래 신호를 필터링 및 우선순위를 지정하는 것을 고려합니다.
- 최적화 근거: 머신러닝은 인간이 식별하기 어려운 복잡한 패턴을 발견하여 전략의 지능 수준을 높일 수 있습니다.
이러한 최적화 방향을 구현함으로써 전략은 원래의 장점을 유지하면서 적응성, 정확성 및 장기 수익성을 크게 향상시키고, 다양한 시장 조건에서의 문제에 더 잘 대응할 수 있습니다.
요약
동적 피보나치 지표를 활용한 다차원 피봇 포인트 트레이딩 시스템은 포괄적이고 잘 구조화된 데이 트레이딩 전략 시스템입니다. 이 시스템은 전통적인 기술적 분석 도구(피봇 포인트, 피보나치 되돌림, 이동평균선)와 현대적인 동적 지표(VWAP, CPR)를 교묘하게 결합합니다. 엄격한 캔들 조건 심사와 여러 지표 확인을 통해 트레이더에게 유망한 데이 트레이딩 프레임워크를 제공합니다.
이 전략의 핵심 강점은 주요 가격 수준에 대한 포괄적인 커버리지와 잠재적 반전 지점에 대한 민감한 포착에 있습니다. 엄격한 캔들 식별 조건을 설정함으로써, 전략은 대량의 의미 없는 시장 노이즈를 걸러내고 높은 확률의 거래 기회에 집중할 수 있습니다. 동시에 거래량 및 모멘텀 지표의 사용은 신호 신뢰성을 더욱 향상시킵니다.
그러나 이 전략은 또한 일부 한계가 있습니다, 예를 들어 과도한 신호 발생 가능성, 역추세 거래 리스크, 매개변수 최적화 과제 등입니다. 이러한 문제를 해결하기 위해 우리는 동적 매개변수 조정, 다중 시간 프레임 확인, 지능형 자본 관리, 시장 환경 적응 등 여러 최적화 방향을 제안했습니다. 이러한 최적화는 트레이더가 자신의 필요와 시장 특성에 따라 전략을 조정하여 전체 거래 효율성을 개선하는 데 도움이 될 수 있습니다.
주목할 점은 어떤 거래 전략도 '만능 해결책'이 아니라는 것입니다. 성공적인 거래는 전략 자체뿐만 아니라 트레이더의 인내, 규율, 지속적인 학습에 달려 있습니다. 이 전략의 경우, 트레이더가 먼저 시뮬레이션 환경에서 철저히 테스트하고, 다양한 시장 조건에서의 성능 특성을 숙지한 후, 점진적으로 매개변수를 조정하여 특정 거래 상품과 개인 스타일에 적응시키고, 궁극적으로 개인화된 지속 가능한 수익 시스템을 구축하는 것이 권장됩니다.
지속적인 실습, 피드백 및 최적화를 통해 동적 피보나치 지표를 활용한 다차원 피벗 포인트 거래 시스템은 데이 트레이더의 도구 상자에서 강력한 무기가 되어 단기 시장 기회를 포착하기 위한 신뢰할 수 있는 기술적 분석 프레임워크를 제공할 수 있습니다.
이 전략은 전통적인 피벗 포인트와 현대 기술 도구를 통합하여 시장 구조를 존중하면서도 데이 트레이딩 가격 움직임에 민감하게 반응하는 균형 잡힌 접근 방식을 만듭니다. 주요 가격 수준에서의 핵심 가격 상호작용에 초점을 맞춤으로써 트레이더는 시장 심리에 대한 더 깊은 이해를 발전시키고 잠재적으로 거래 성과를 향상시킬 수 있습니다.
궁극적으로 성공적인 구현은 신중한 사용자 정의, 엄격한 테스트, 규율 있는 실행을 필요로 합니다. 건전한 리스크 관리 원칙을 포함한 포괄적인 거래 계획의 일부로 적절히 적용될 때, 이 전략은 더 큰 자신감과 정확성으로 데이 트레이딩 시장의 복잡성을 탐색하는 체계적인 방법을 제공합니다.
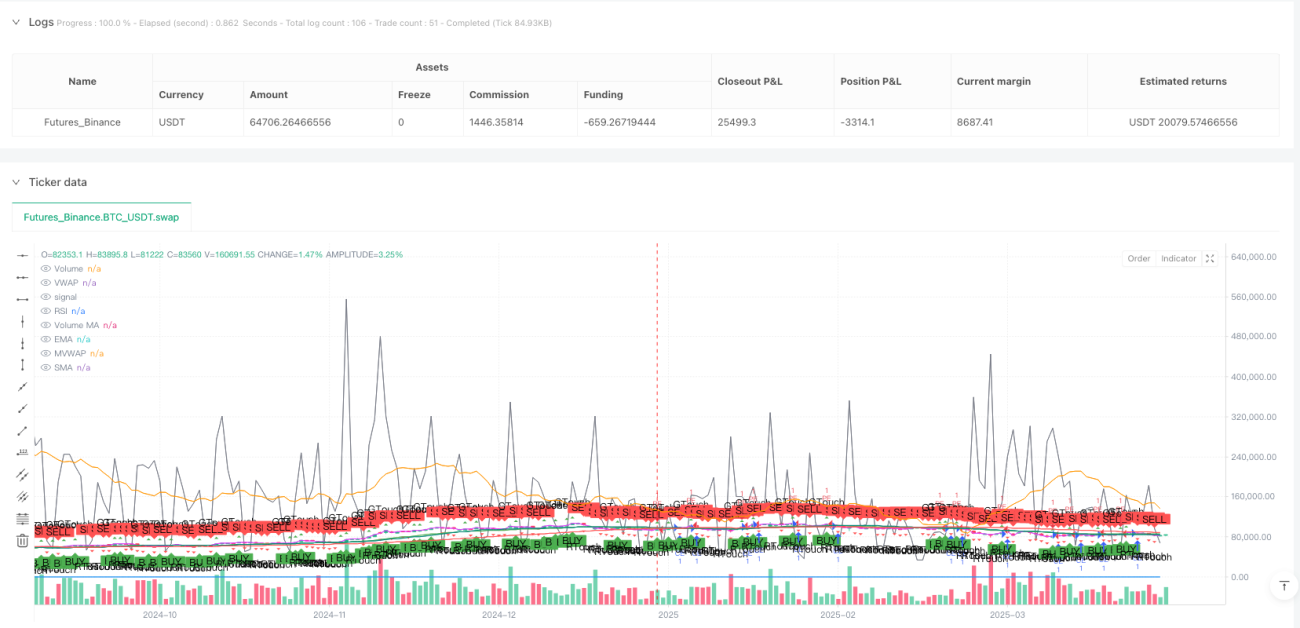
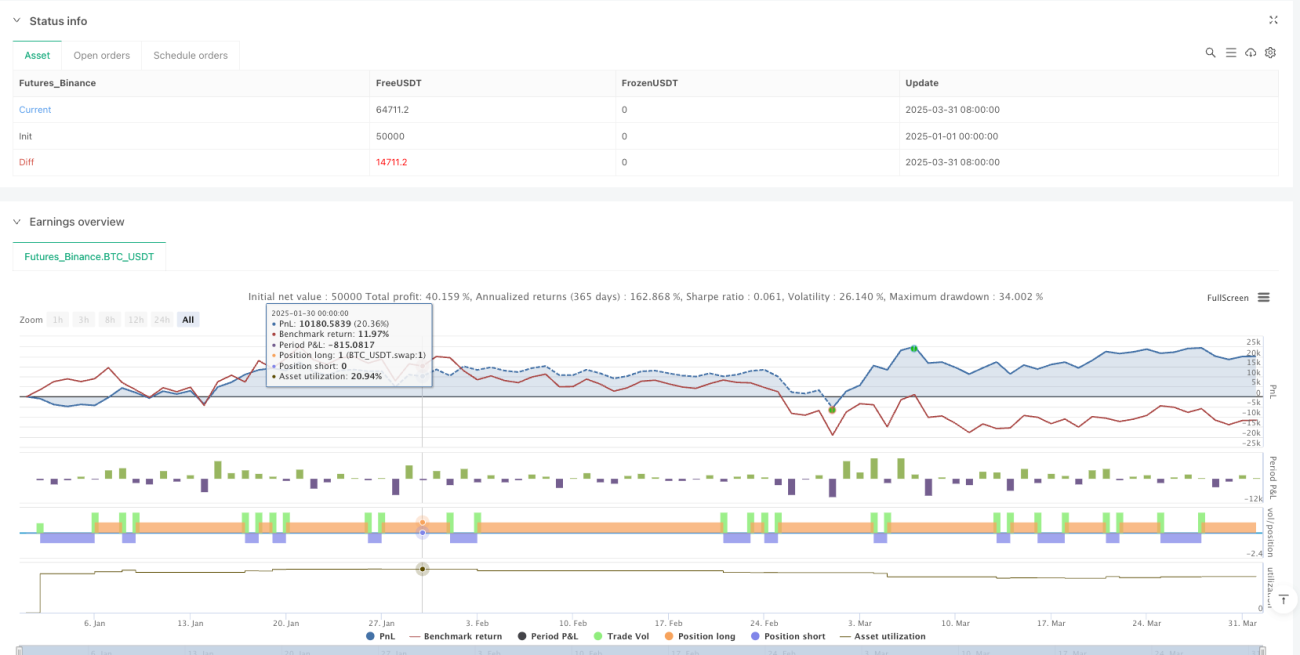
/*backtest
start: 2025-01-01 00:00:00
end: 2025-04-01 00:00:00
period: 1d
basePeriod: 1d
exchanges: [{"eid":"Futures_Binance","currency":"BTC_USDT"}]
*/

//@version=5
strategy("Pivot Point CE/PE Strategy", overlay=true)

// Identify 3-minute candles (Assuming the script is applied to a 3-minute chart)- 1