
2
Follow
502
Followers
개요
이것은 복잡한 다중 지표 거래 전략으로, 거래량 가중 평균 가격(AVWAP), 고정 범위 거래량 분포(FRVP), 지수 이동 평균(EMA), 상대 강도 지수(RSI), 평균 방향 지수(ADX) 및 이동 평균 수렴 발산(MACD) 등 여러 기술적 분석 도구를 결합하여 지표 집계를 통해 고확률 거래 기회를 식별하는 것을 목표로 합니다.
전략 원리
전략은 다중 조건을 통해 진입 신호를 결정합니다:
- 가격과 AVWAP의 교차
- 가격의 EMA 대비 위치
- RSI 강도 판단
- MACD 추세 모멘텀
- ADX 추세 강도 확인
- 거래량 필터
전략은 일반적으로 유동성이 높고 거래 신호가 더 신뢰할 수 있는 아시아, 런던 및 뉴욕 거래 세션에 집중합니다. 진입 로직은 롱 및 숏 두 가지 모드를 포함하며, 단계별 이익 실현 및 손절 메커니즘을 설정했습니다.
전략 장점
- 다중 지표 조합으로 신호 정확도 향상
- 동적 거래량 필터링으로 낮은 유동성 거래 회피
- 유연한 이익 실현 및 손절 전략
- 다양한 거래 세션 기반 전략 최적화
- 동적 위험 관리 메커니즘
- 시각적 신호로 의사 결정 지원
전략 위험
- 다중 지표 조합으로 신호 복잡성 증가 가능
- 백테스트 데이터에 과적합 위험 존재
- 시장 상황에 따라 성능이 불안정할 수 있음
- 거래 비용 및 슬리피지가 실제 수익에 영향을 줄 수 있음
전략 최적화 방향
- 머신러닝 알고리즘 도입으로 매개변수 동적 조정
- 더 많은 거래 세션 적응성 추가
- 이익 실현 및 손절 전략 최적화
- 더 많은 필터 조건 도입
- 여러 종목에 적용 가능한 범용 전략 모델 개발
요약
이것은 고도로 맞춤화되고 다차원적인 거래 전략으로, 여러 기술 지표와 거래 세션 특성을 통합하여 거래 신호의 품질과 정확도를 높이려고 합니다. 이 전략은 퀀트 거래에서 지표 집계와 동적 위험 관리의 복잡성을 보여줍니다.
Source
Pine
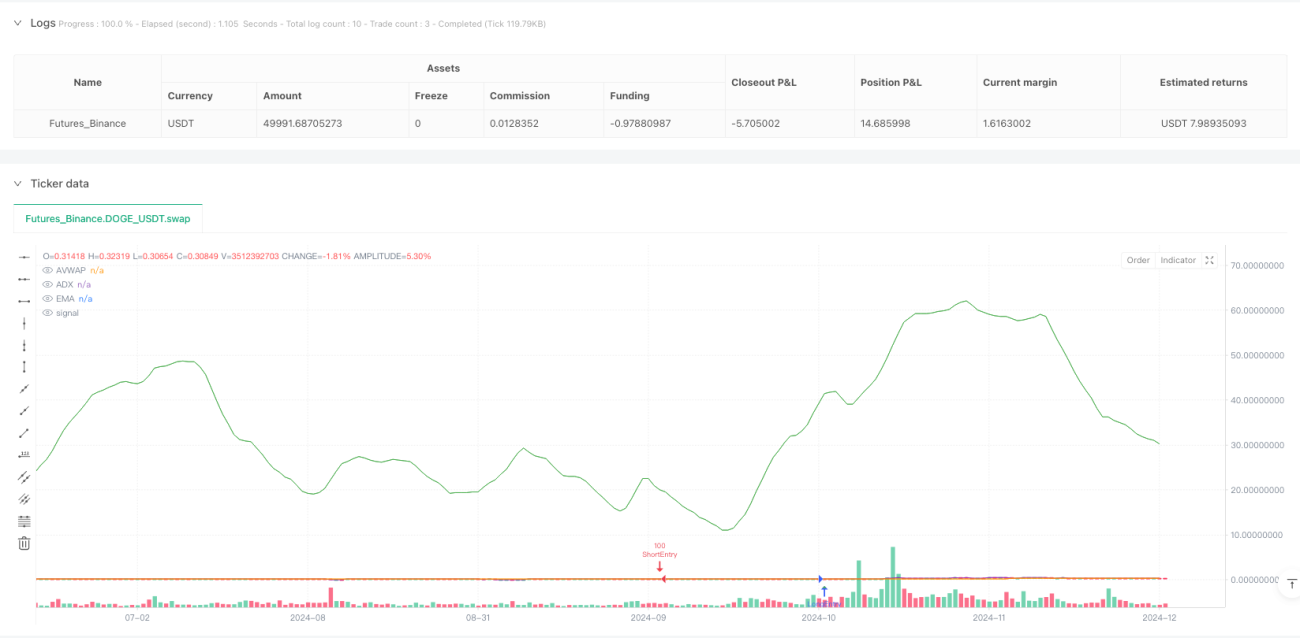
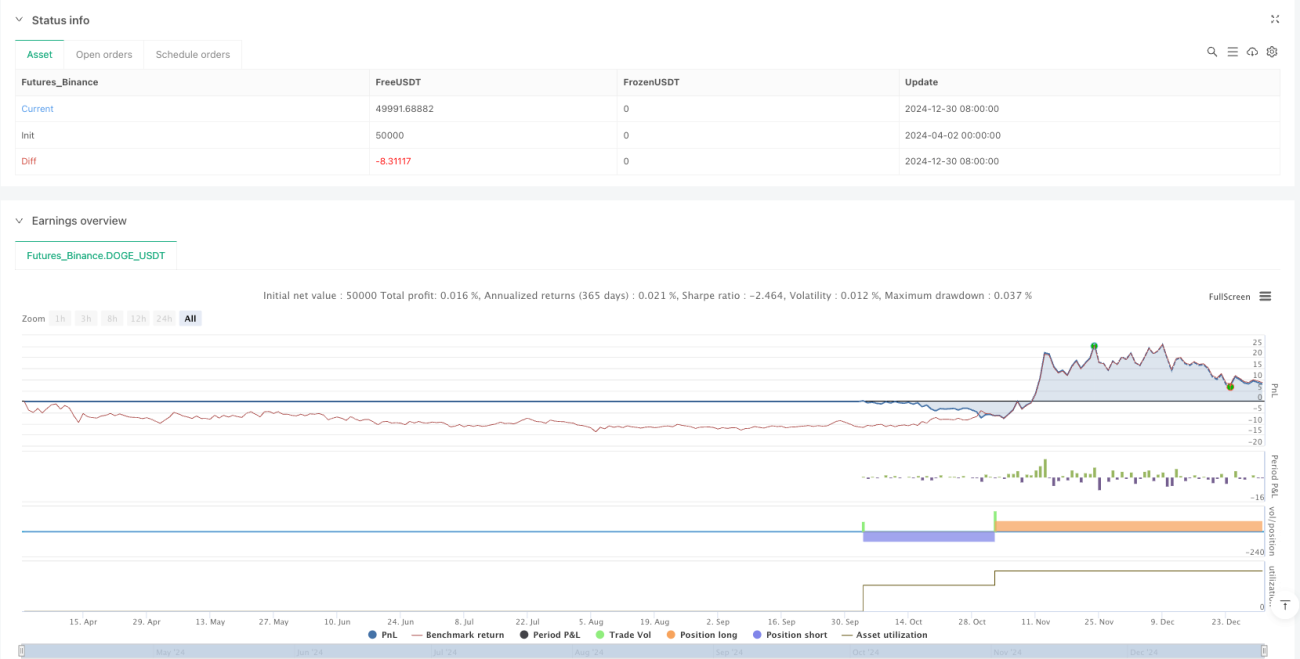
/*backtest
start: 2024-04-02 00:00:00
end: 2024-12-31 00:00:00
period: 1d
basePeriod: 1d
exchanges: [{"eid":"Futures_Binance","currency":"DOGE_USDT"}]
*/

//@version=6
strategy("FRVP + AVWAP by Grok", overlay=true, initial_capital=10000, default_qty_type=strategy.percent_of_equity, default_qty_value=100)

// User InputsStrategy parameters
Related strategies
Comment
All comments (0)
No data
- 1