다중 매개변수 교차 추세 모멘텀 전략

2
Follow
481
Followers
개요
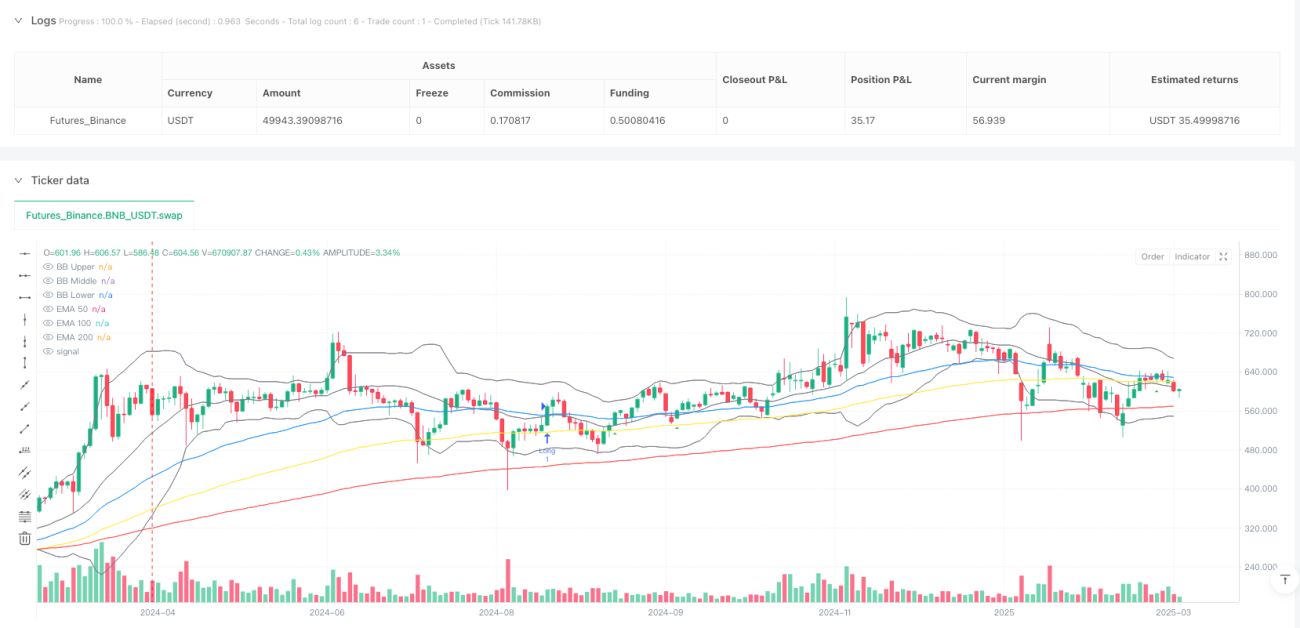
이것은 지수 이동 평균 (EMA), 상대적으로 강한 지수 (RSI), 이동 평균 수축 (MACD), 그리고 볼링거 밴드 (Bollinger Bands) 를 결합한 복잡한 다중 지수 거래 전략이며, 잠재적 인 거래 진입 지점을 다중 신호 검증 방식으로 식별하기 위해 설계되었습니다. 이 전략은 트렌드 가격 움직임을 포착하고 엄격한 신호 필터링 메커니즘을 통해 잘못된 신호의 가능성을 줄이는 데 초점을 맞추고 있습니다.
전략 원칙
이 전략의 핵심은 4개의 핵심 기술 지표에 대한 통합 분석에 기초하고 있습니다.
- 3개의 다른 기간의 지수 이동 평균을 사용하여 전체적인 경향 방향을 판단하기 위해 ((50, 100, 200)
- RSI를 통해 시장의 역동성과 과매매를 평가합니다.
- MACD 선과 신호 선의 교차로 트렌드 동력을 판단합니다.
- 부린 벨트와 함께 하향 레일로 추가 가격 변동 참조
특정 입학 논리는 다음과 같습니다:
-
더 많은 조건이 있습니다.
- 50일 EMA를 쓰면
- 50일 EMA는 100일 EMA보다 높고, 100일 EMA는 200일 EMA보다 높습니다.
- RSI는 50~70입니다.
- MACD 라인은 신호 라인보다 높습니다.
-
공백 조건:
- 50일 EMA를 마감 가격 아래로
- 50일 EMA는 100일 EMA보다 낮고, 100일 EMA는 200일 EMA보다 낮습니다.
- RSI는 30~50 사이입니다.
- MACD 라인은 신호 라인보다 낮습니다.
전략적 이점
- 다중 지표 검증: 4개의 다른 지표의 조합을 통해 신호의 신뢰성을 크게 향상시킵니다.
- 트렌드 추적 능력: 트리플 EMA 구조를 사용하여 시장 지배적 인 트렌드를 효과적으로 식별합니다.
- 동력 판단의 정확성: RSI와 MACD의 결합은 더 정확한 진입 시기를 제공합니다.
- 위험 관리: 엄격한 입시 조건으로 잘못된 거래의 확률이 낮아집니다.
- 시각적 명확성: 전략이 명확한 시각적 입문 신호와 트렌드 지시를 제공합니다.
전략적 위험
- 여러 지표의 복잡성이 신호 지연을 유발할 수 있다.
- 위기 시장에서 더 많은 무효 신호가 발생할 수 있습니다.
- 고정 변수는 모든 시장 환경에 적합하지 않을 수 있습니다.
- 잠재적으로 더 큰 회수 위험이 있습니다.
전략 최적화 방향
- 적응 변수 조정 메커니즘을 도입
- 더 많은 스톱 로드 전략
- 다양한 시장 주기적 동력에 따라 입점 하락값을 조정
- 진입 신호를 추가로 검증하기 위해 변동률 지표와 결합
- 평가 및 최적화 지표의 최적의 조합
요약하다
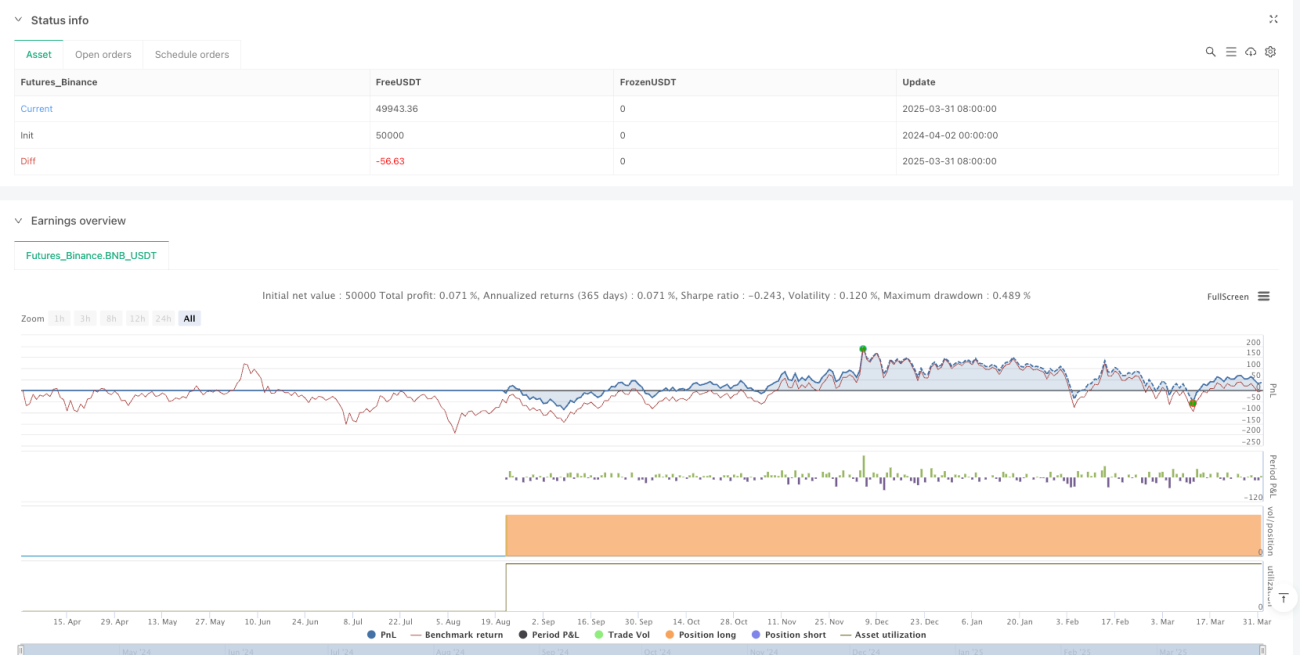
이것은 매우 체계화된 다중 변수 교차 동향 동력 전략으로, 네 가지 기술 지표의 복합 검증을 통해 보다 정확하고 신뢰할 수 있는 거래 신호를 제공하고자 합니다. 전략은 상당한 장점이 있지만, 지속적인 최적화와 위험 관리가 필요합니다.
Source
Pine
Strategy parameters
Comment
All comments (0)
No data
- 1