
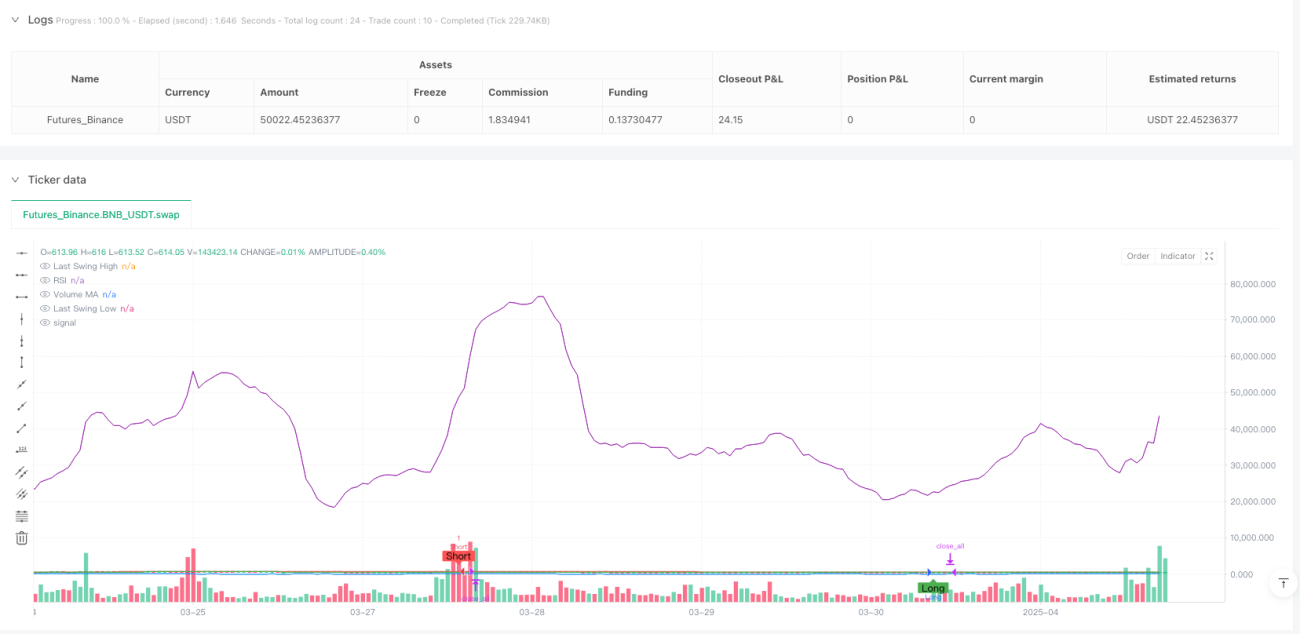
개요
"시장 구조 돌파와 거래량 피크, RSI 다중 지표 교차 전략"은 시장 구조(SMC), 거래량 돌파 및 상대강도지수(RSI)를 결합한 다중 지표 거래 전략입니다. 이 전략은 주로 주요 변동점(swing points)을 식별하여 시장 구조를 분석하고, 구조 돌파 시 거래량 피크 및 RSI 지표를 활용해 거래 신호를 확인합니다. 전략의 설계 목적은 잠재적인 시장 반전 또는 돌파 지점을 식별하여 보다 정확한 거래 진입 타이밍을 제공하고, 가짜 돌파로 인한 위험을 줄이는 데 있습니다.
전략 원리
이 전략의 핵심 원리는 다중 지표의 공진을 통해 거래 신호의 유효성을 확인하는 것입니다. 전략 작동 과정은 다음과 같습니다:
- 변동점 식별: 피봇(pivot) 함수를 사용하여 시장의 고점(pivot high)과 저점(pivot low)을 식별하며,
swing_len매개변수로 되돌아보기 기간을 제어합니다. - 시장 구조 분석: 가장 최근에 확인된 고점과 저점을 지속적으로 기록 및 갱신하며, 이 지점들이 시장 구조의 지지 및 저항 영역을 형성합니다.
- 거래량 확인: 거래량의 단순이동평균(SMA)을 계산하여 거래량 돌파 상황을 식별하고, 현재 거래량이 평균 거래량의 지정된 배수보다 클 때 거래량 피크로 판단합니다.
- RSI 필터: 상대강도지수(RSI)를 추가 필터 조건으로 활용하여 신호의 신뢰성을 강화합니다.
- 거래 신호 생성:
- 롱(Long) 신호: 가격이 이전 저점(구조 돌파)을 돌파하고, 거래량 피크가 발생하며, RSI가 50 미만(과매도 가능성)일 때
- 숏(Short) 신호: 가격이 이전 고점(구조 돌파)을 하향 돌파하고, 거래량 피크가 발생하며, RSI가 50 초과(과매수 가능성)일 때
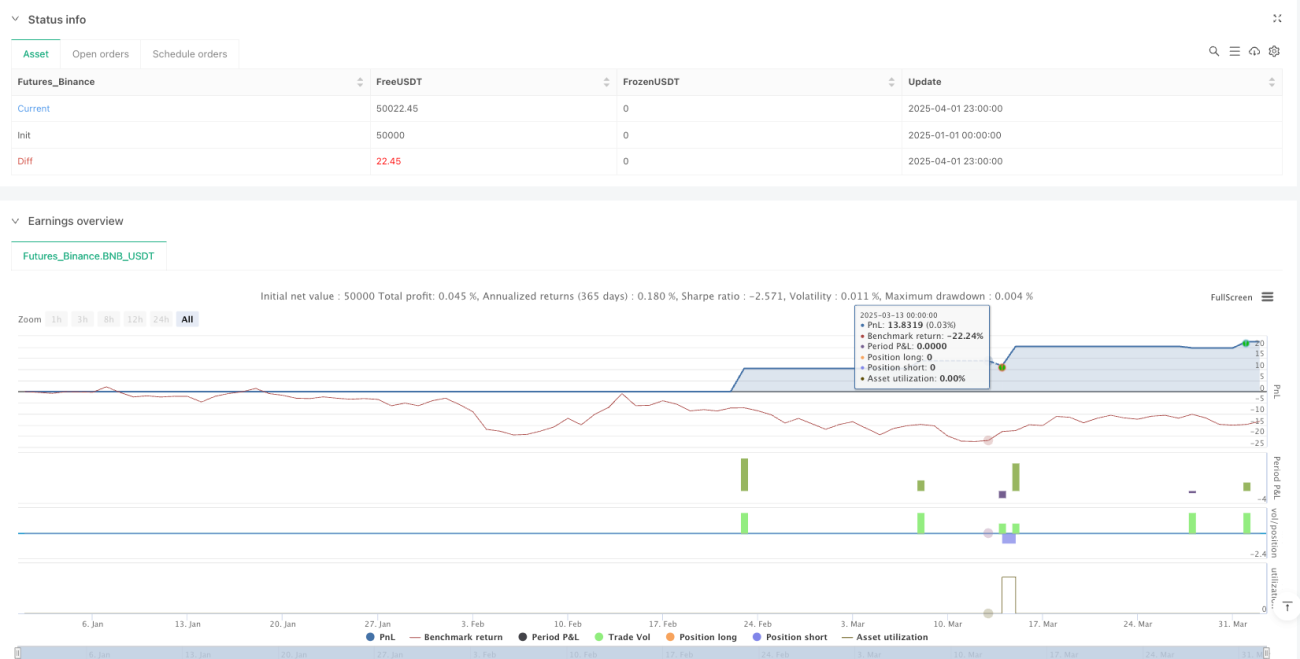
- 포지션 관리: 고정 보유 기간 전략을 사용하여 거래 시작 후 지정된 수의 캔들(holdBars)을 보유한 후 청산합니다.
전략 장점
- 구조화된 시장 분석: 전략은 주요 변동점을 식별하여 트레이더에게 명확한 시장 구조 관점을 제공하며, 가격 움직임의 본질을 이해하는 데 도움을 줍니다.
- 다중 지표 확인: 거래량과 RSI 지표를 결합하여 신호를 확인함으로써 가짜 돌파 위험을 크게 낮추고 거래 신호의 품질을 향상시킵니다.
- 거래량 검증: 거래량은 가격 이동의 동력이며, 거래량 피크 요구 조건은 가격 돌파를 뒷받침할 충분한 시장 참여를 보장합니다.
- RSI 반대면 확인: 전략의 RSI 설정(롱 신호는 RSI<50, 숏 신호는 RSI>50 요구)은 역발상 확인 메커니즘을 제공하여 과매수/과매도 반전 기회를 포착하는 데 도움이 됩니다.
- 명확한 보유 기간: 고정 보유 기간은 청산 시점에 대한 주관적 판단의 어려움을 없애고, 단일 거래의 위험 노출 시간을 제한합니다.
- 높은 맞춤성: 전략은 변동점 되돌아보기 기간, 거래량 이동평균 길이, 거래량 배수, RSI 기간, 보유 기간 등 여러 조정 가능한 매개변수를 제공하여 트레이더가 다양한 시장 및 시간 프레임에 맞춰 최적화할 수 있습니다.
전략 리스크
- 가짜 돌파 위험: 전략이 다중 지표 확인을 사용하더라도, 특히 변동성이 큰 시장 환경에서는 가짜 돌파가 발생할 수 있습니다.
- 해결 방법: 추가 확인 지표를 도입하거나 돌파 확인을 위한 캔들 수를 늘리는 것을 고려할 수 있습니다.
- 고정 보유 기간의 한계: 고정 보유 기간은 추세가 완전히 전개되기 전에 조기 청산되거나, 추세 반전 후에도 여전히 포지션을 유지하게 할 수 있습니다.
- 해결 방법: 트레일링 스탑 또는 기술적 지표 기반 청산 신호와 같은 동적 청산 메커니즘을 도입하는 것을 고려하십시오.
- 매개변수 최적화 함정: 매개변수를 과도하게 최적화하면 역사적 데이터에서 좋은 성과를 보일 수 있지만 실전에서는 좋지 않은 결과를 초래할 수 있습니다.
- 해결 방법: 충분히 긴 백테스팅 기간을 사용하고 다양한 시장 환경에서 전략의 견고성을 테스트하여 강건한 매개변수 최적화를 수행하십시오.
- 손절 메커니즘 부재: 현재 전략에는 명확한 손절 메커니즘이 없어 단일 거래의 손실이 과도해질 수 있습니다.
- 해결 방법: 변동성 기반 또는 고정 비율의 손절 메커니즘을 추가하십시오.
- 거래 빈도 문제: 매개변수 설정에 따라 특정 시장 조건에서 신호가 너무 많거나 너무 적게 발생할 수 있습니다.
- 해결 방법: 특정 시장의 변동성 특성에 맞게 매개변수를 조정하거나 거래 빈도 제어 메커니즘을 추가하십시오.
전략 최적화 방향
- 동적 청산 메커니즘: 현재 전략은 고정 보유 기간을 사용하여 청산합니다. 보다 동적인 청산 메커니즘을 도입할 수 있습니다:
- 트레일링 스탑: 시장 구조 또는 ATR(Average True Range)을 기반으로 동적 손절선 설정.
- 반대 신호 청산: 현재 포지션 방향과 반대되는 신호 발생 시 청산.
- 이익 목표: 시장 구조 또는 주요 저항/지지 레벨을 기반으로 이익 목표 설정.
- 리스크 관리 보완:
- 손절 메커니즘 도입: 변동성(예: ATR 배수) 또는 고정 비율 기반 손절 설정.
- 포지션 관리: 시장 변동성 또는 신호 강도에 따라 포지션 크기 조정.
- 리스크 통제: 일/주 최대 거래 횟수 및 최대 위험 노출 제한.
- 신호 품질 강화:
- 추세 필터: 장기 추세 판단을 추가하여 추세 방향으로만 포지션 진입.
- 시간 필터: 중요한 경제 지표 발표 전후 거래 회피.
- 변동성 필터: 너무 높거나 낮은 변동성 환경에서 전략 매개변수 조정 또는 거래 중단.
- 다중 시간 프레임 확인:
- 더 긴 시간 프레임의 시장 구조 분석을 도입하여 여러 시간 프레임 구조가 일치할 때만 거래.
- 이러한 최적화는 잡음 거래를 줄이고 큰 추세 포착 능력을 향상시킵니다.
- 머신러닝 강화:
- 머신러닝 알고리즘을 사용하여 매개변수 선택을 최적화하고, 다양한 시장 환경에 따라 전략 매개변수를 자동으로 조정.
- 패턴 인식 알고리즘을 도입하여 시장 구조 식별의 정확성을 향상.
요약
"시장 구조 돌파와 거래량 피크, RSI 다중 지표 교차 전략"은 시장 구조 분석, 거래량 확인 및 RSI 지표 필터를 결합하여 체계적인 거래 방법을 제공하는 종합적인 거래 시스템입니다. 이 전략의 핵심 장점은 다중 지표의 공진 확인을 통해 거래 신호의 신뢰성을 크게 높인다는 점입니다.
전략의 주요 특징은 변동점(swing points)을 사용하여 시장의 핵심 구조를 식별한 후, 가격이 이러한 구조를 돌파할 때 거래량 피크와 RSI 지표를 결합하여 거래를 확인하는 것입니다. 이 방법은 시장 구조의 변화를 포착할 수 있을 뿐만 아니라 거래량과 RSI의 보조 확인을 통해 가짜 돌파 위험을 줄일 수 있습니다.
그럼에도 불구하고, 이 전략은 특히 청산 메커니즘, 리스크 관리 및 신호 품질 측면에서 최적화의 여지가 있습니다. 더 동적인 청산 전략 도입, 리스크 관리 시스템 보완 및 신호 필터 메커니즘 강화를 통해 전략의 견고성과 수익성을 더욱 향상시킬 수 있습니다.
가장 중요한 것은, 트레이더가 이 전략을 사용할 때 신호를 기계적으로 따르는 것이 아니라 그 이면에 있는 시장 구조 개념을 이해해야 한다는 것입니다. 시장 구조 변화의 본질을 이해하고 거래량과 RSI 지표의 보조 분석을 결합해야만 이 전략의 잠재력을 진정으로 발휘할 수 있습니다.
/*backtest
start: 2025-01-01 00:00:00
end: 2025-04-02 00:00:00
period: 1h
basePeriod: 1h
exchanges: [{"eid":"Futures_Binance","currency":"BNB_USDT"}]
*/

//@version=5
strategy("SMC Structure Break with Volume Spike + RSI Confluence", overlay=true, initial_capital=100000, currency=currency.USD)

// ===== INPUTS =====- 1