
2
Follow
502
Followers
개요
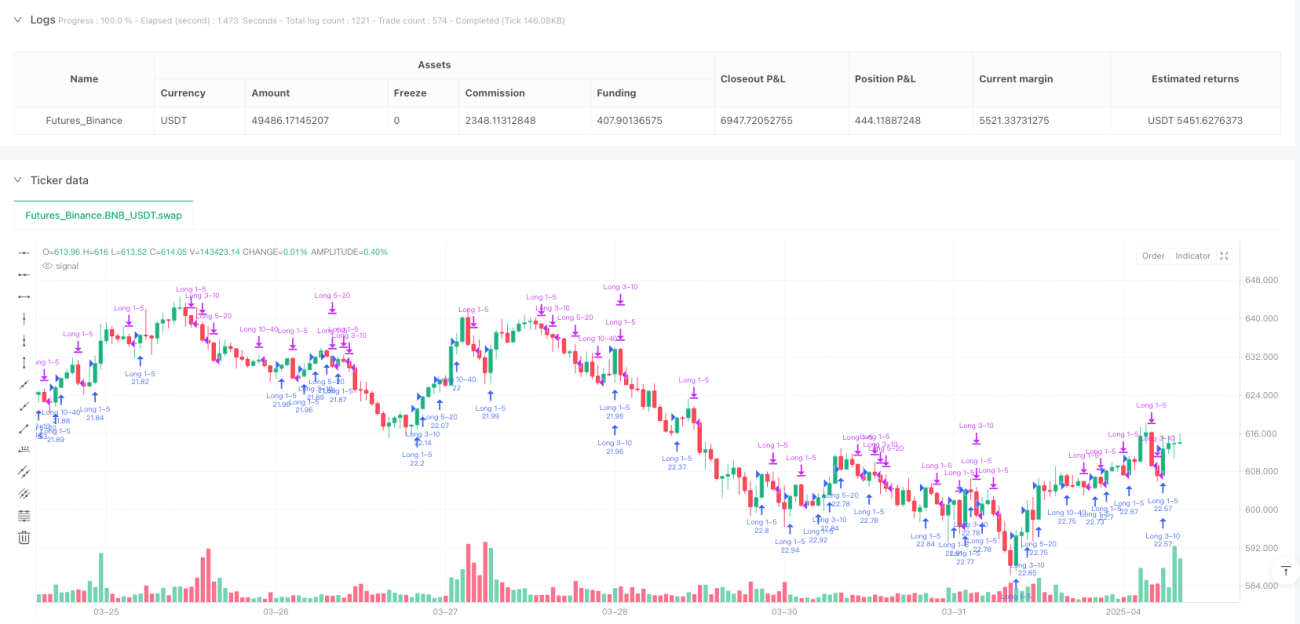
이는 다중 지수이동평균(EMA) 교차를 기반으로 하는 퀀트 트레이딩 전략으로, 서로 다른 시간 주기의 EMA 교차점을 포착하여 시장 추세를 식별하고 거래 신호를 생성합니다. 이 전략은 단계적 확인을 통해 시장 모멘텀을 포착하고 직관적인 시각적 추세 판단 메커니즘을 제공하는 것을 목표로 합니다.
전략 원리
전략의 핵심 로직은 서로 다른 주기의 4가지 EMA 교차 신호에 기반합니다:
- 첫 번째 진입 신호: 1일 EMA가 5일 EMA를 상향 돌파, 초기 상승 모멘텀을 나타냄
- 두 번째 진입 신호: 3일 EMA가 10일 EMA를 상향 돌파, 더 강한 상승 추세를 확인
- 세 번째 진입 신호: 5일 EMA가 20일 EMA를 상향 돌파, 추세의 추가 발전을 표시
- 네 번째 진입 신호: 10일 EMA가 40일 EMA를 상향 돌파, 장기 강세 모멘텀을 시사
전략은 색상 코딩을 통해 시장 심리를 직관적으로 표시합니다: 파란색 계열은 강세, 빨간색 계열은 약세를 나타냅니다. 색상의 농도는 단기 EMA가 장기 EMA에 비해 상대적인 위치 관계를 반영합니다.
전략 장점
- 점진적 확인: 다중 EMA 교차는 계층적 추세 확인 메커니즘을 제공
- 시각적 피드백: 막대 차트 색상이 시장 심리 변화를 신속하게 표시
- 높은 유연성: 비트코인 등 추세가 뚜렷한 시장에 적용 가능
- 동적 포지션 관리: 단계적으로 포지션을 늘려 단일 거래의 위험을 낮춤
- 추세 추종 능력: 다양한 시간 규모의 시장 모멘텀을 포착 가능
전략 리스크
- 지연성: EMA는 후행 지표로, 급격한 가격 변화에 느리게 반응할 수 있음
- 가짜 돌파 리스크: 횡보장에서 잘못된 신호를 생성할 수 있음
- 롱 포지션 리스크: 피라미드식 포지션 구축은 전체 위험 노출을 증가시킬 수 있음
전략 최적화 방향
- 거래량 확인, 변동성 지표 등의 추가 필터 조건 도입
- 켈리 기준 등 손절 메커니즘 결합으로 단일 거래 리스크 통제
- 다양한 시장 환경에 맞춰 EMA 매개변수 조정
- 추세 강도 평가 모듈 추가
- 머신러닝 알고리즘 도입으로 진입 전략 동적 조정
요약
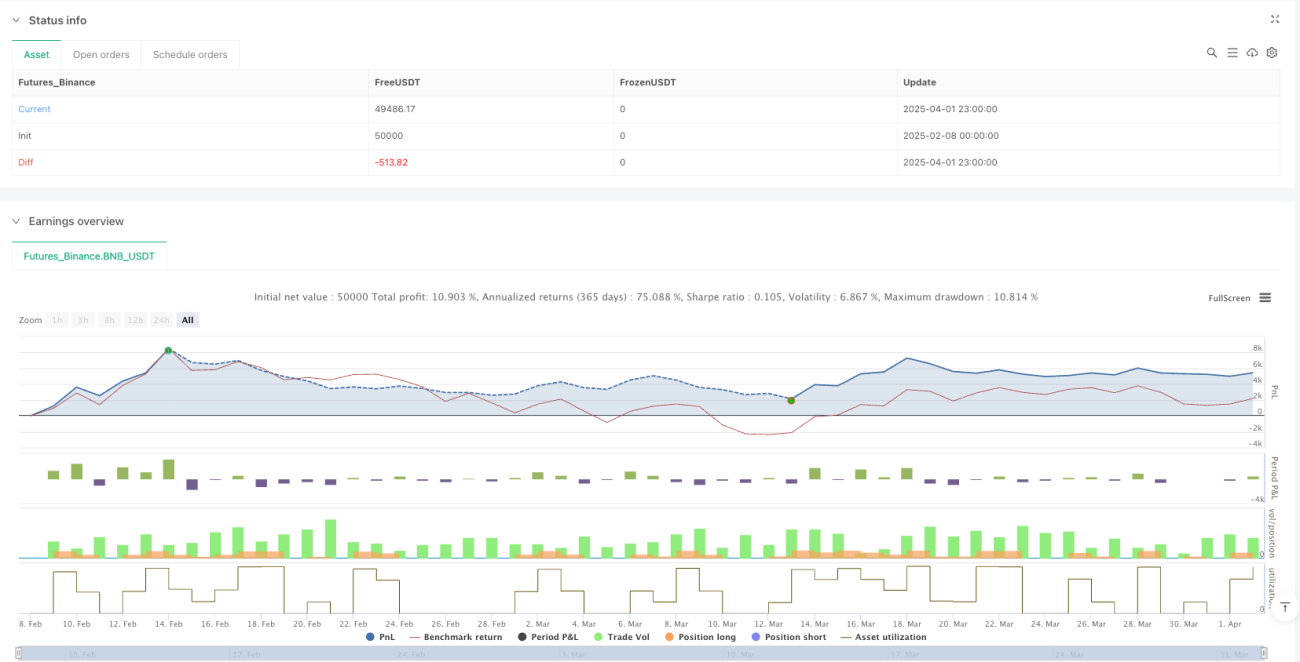
다중 EMA 교차 전략은 점진적 신호 생성과 직관적인 시각화 메커니즘을 통해 트레이더에게 시장 추세를 포착하는 체계적인 방법을 제공합니다. 일부 한계가 있지만 지속적인 최적화와 리스크 관리를 통해 이 전략은 여전히 실질적인 가치를 지닙니다.
Source
Pine
Related strategies
Comment
All comments (0)
No data
- 1